Optimize Your Power Modeling with Vulcan

This week, we incorporated delayed dates based on historical project analysis by technology type. The consistency of delays is a function of the time to online. The further out a project's expected online date, the greater the number of days we add to account for delays. This trend is consistent across all technologies. Below is a sample chart illustrating this analysis for onshore wind projects since 2016.
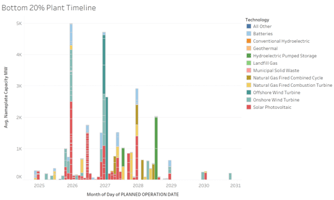
Vulcan clients have access to individual plant rankings (as discussed in Enhancing Genstack Forecasting: New Project Ranking System & Vulcan UC Integration for Accurate Power Modeling) and Vulcan's projected online dates for proposed projects. By excluding the bottom-ranked units, which are likely to be canceled, clients can create a more realistic projection of the generation stack. In the examples below, we removed the bottom 20% of plants. This data, accessible through download or Snowflake integration using EIA plant and gen IDs, can be easily incorporated into a new genstack case for your power model.
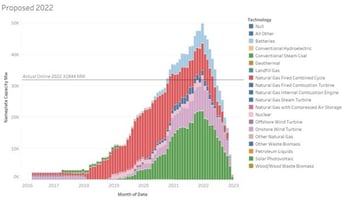
The September 2024 EIA 860M projected over 183 GW of capacity by 2030. The peak years of impact are 2025, with over 50 GW, and 2026, with nearly 45 GW.
In contrast, the Vulcan case presents a more moderate build profile, totaling 140 GW by 2030.
A historical analysis of the Vulcan ranking method, using December 2021 as a benchmark, demonstrated 65% accuracy in identifying the 15.8 GW of plants that were ultimately canceled.
Vulcan is a powerful, state-of-the-art platform offering in-depth analytics and research to generate alpha for your organization. Vulcan UC will significantly enhance your power modeling efforts and provide valuable insights into macro power trends, from gas burns to reliability concerns. The sooner you subscribe, the greater the value you'll realize for your organization.