At Synmax, we take client feedback seriously. One piece of feedback we received was a request for Vulcan to forecast, or at least assist in forecasting, the entire genstack moving forward, rather than simply identifying critical construction milestones. While we initially focused on visual confirmation (which is irrefutable), we recognize the need for a broader perspective.
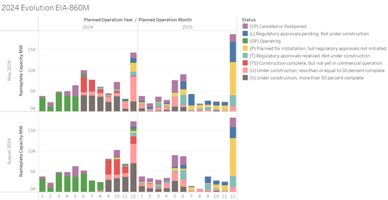
To provide a more comprehensive forecast, we delved into the macro aspects of proposed plant builds from the EIA-860M, as discussed in "Unlock Deeper Insights: Vulcan Platform's Ground-Level Analysis & EIA-860M Integration for Accurate Power Modeling." We understand that, on a macro scale, 20-30% of plants are typically canceled. However, a broad-brush approach to these macro numbers can obscure important details within the project database.
To reconcile these macro trends with individual project data, we developed a project ranking system. This system considers factors such as owner history, technology type, state location, EIA status, days since proposed, and Vulcan status. We assigned rankings to each category based on historical cancellation and success rates. Clients have access to the historical data, which we've pulled from the EIA-860M since 2015 and published to Snowflake. This data is updated regularly. We also applied a 2x boost to projects confirmed or identified as under construction by Vulcan.
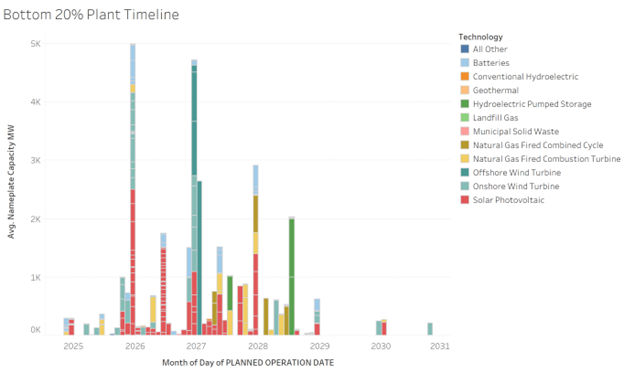
Using this ranking system, clients can quickly identify the bottom 20% of projects (approximately 35 GW) that are likely to be canceled and should be excluded from the genstack. Clients have full access to these rankings by plant and can create custom charts in Tableau using our Snowflake integration.
As expected, projects without regulatory approvals have the highest cancellation rate.
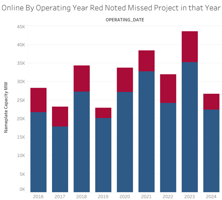
Wind projects are more likely to be canceled than solar projects, even though their proportions are similar, due to the larger overall solar build. Additionally, projects with later proposed dates have a higher propensity for cancellation.
In terms of where we see the most cancellation to no surprise to many developers – California.
The next phase of Vulcan UC will incorporate historical expected delays into the projected online dates of projects. These delays will be applied to lower-ranked projects (20-40%). By incorporating these delays, we can create a more accurate plant-by-plant projected genstack, addressing our clients' needs.
Vulcan UC provides visually confirmed evidence of construction or non-construction for over 130 GW of projects. Projects under construction are categorized by first land clear and first structure dates, with the latter confirming a higher likelihood of completion. These initial dates allow us to project an earliest online date. Combined with the project ranking system, we can identify and remove likely canceled projects from your genstack, leading to more accurate power model results.
Invest in Your Success: Subscribe to Vulcan Today