The recent EIA-860M update reveals an unprecedented number of new projects, surpassing any previous update since 2017. In this single cycle, nearly 35 GW of power plants were added, with solar projects comprising the majority. This surge may be attributed to the Biden administration's Inflation Reduction Act (IRA), which provides significant incentives for renewable energy. Last month's additions were the second largest before this update, further emphasizing the IRA's substantial impact.
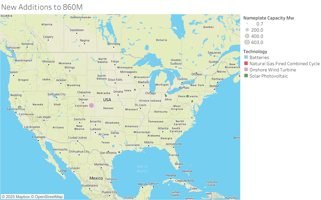
These proposed projects are distributed nationwide, with the highest concentrations in Texas, Arizona, and Washington.
Most of these additions are in the pre-construction phase, with the majority projected to become operational after 2026.
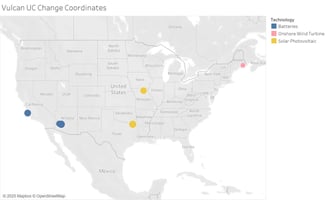
The "null" category represents the "ghost plants" we previously discussed – plants already online. This category accounted for only 586 MW, scattered across the country with various technologies. Two relatively large wind and solar projects were included, while the rest were very small.
Regarding retirements, cancellations, and postponements, the total was only 171 MW, with the largest cancellation occurring in Texas.
The current EIA-860M data indicates a massive build outlook, projecting over 60 GW of construction this year. Given the current supply chain challenges for critical components such as breakers, transformers, and other electrical equipment, this level of construction may be unrealistic.
To provide context, the last time the U.S. added over 60 GW of generating capacity in a single year was in 2002, during the gas generation renaissance.
By applying our Vulcan ranking system and excluding the bottom 20% of projects, we arrive at a more reasonable build expectation build with a peak of nearly 45 GW in 2025.
Vulcan clients have convenient access to all this data by EIA plant and generator ID. This comprehensive dataset enables clients to easily create genstack scenarios for future power modeling or high-level analyses such as gas burns.
In our upcoming webcast on January 24th, 2025, we will discuss these summer build projections and the associated risks, along with a new feature for our clients: Vulcan IW (Infrastructure Watch). Vulcan IW focuses on events ranging from storms to human-caused disasters, providing valuable insights into infrastructure vulnerabilities.
Get Started with a Demo