Analysis of China's Regasification Build-Out - Client Version This week, in collaboration with the...
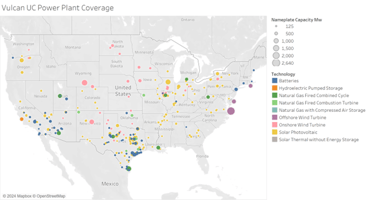
Beyond satellite imaging, Vulcan Platform provides in-depth, ground-level analysis to extract maximum value from your data. We've integrated critical EIA files, including the EIA-860M, into Snowflake for easy visualization with Tableau.
By focusing on proposed power plants, we've delved into the EIA-860M to understand the true evolution of projects. This analysis helps you build a more accurate generation stack based on proposed plants and highlights the value of Vulcan UC.
The following charts illustrate the evolution of proposed plants expected to come online between 2021 and 2023. The peak typically occurs at the end of the previous year before the expected online year.
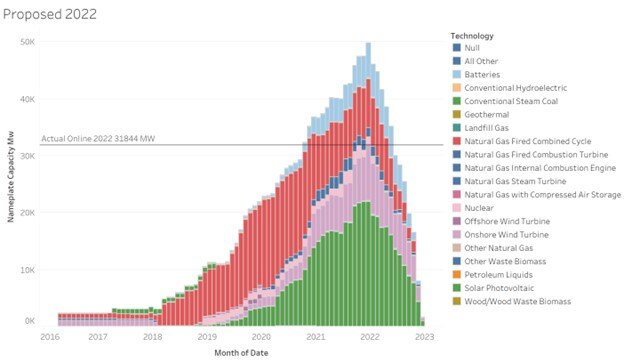
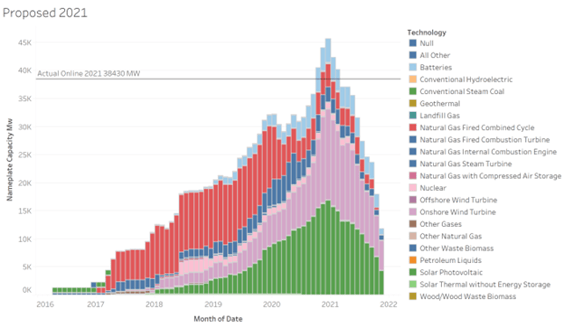
While the overall realization rate of proposed plants seems effective (70-90%), Vulcan Platform's detailed analysis reveals a different story. We've tracked individual projects in each December report from their initial proposal to understand delays and cancellations 12 months out.
The table below shows the results of this analysis – CLIENT ONLY – please subscribe to Vulcan UC.
As you can see, the likelihood of a project coming online within a year of its proposed date is closer to a coin flip. The 2022 subset is expected to see a climb in the delay as it only represents 1 year delay currently whereas the other years have many more years. The Never category in 2022 will likely shift some into the delay category as time continues. The delay subset is substantial highlighting the value of Vulcan UC particularly for power modeling.
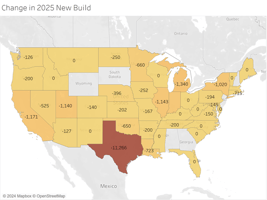
The delay column ultimately impacts the actual capacity added to the grid, but location also plays a crucial role in power trading. Vulcan UC provides visual confirmation of grid evolution, helping you generate alpha.
You can further analyze this data by technology to understand which types of plants are most likely to be on time, delayed, or canceled. For example, gas plants often have a higher likelihood of being on time due to their longer construction timelines, under construction has likely occurred for gas plant being expected online in 12 months compared to solar or battery projects. In addition, more projects proposed the success rate drops as seen in the solar trend – inversely true with gas plants.
The table below shows the results of this analysis – CLIENT ONLY – please subscribe to Vulcan UC.

This analysis is based on projects proposed within 12 months. The picture might be different for projects proposed more than two years out. We will incorporate this knowledge into our development of a Vulcan genstack - soon to come.
We've recently added 44 more solar plants, totaling over 4.6 GW. We'll continue to expand and improve Vulcan UC to make it an indispensable tool for your energy trading and planning needs.