Week Ending July 24, 2026 SynMax Analytics | Published July 29, 2026 Headline SynMax models a +33...
Weekly Storage and S/D Brief - week ending 7/17/2026
Headline: Injection modeled at +36 Bcf
SynMax's S/D models point to a continuation of the trend of decreasing weekly injections as power burn reaches a new summer high of 51.1 Bcf/d — with a Pacific heat wave adding +1.4 Bcf/d to an already-stretched cooling load — while a Freeport LNG outage provides a partial offset by cutting feedgas nearly 1 Bcf/d.
Review the full analysis on the dashboard.
Storage Summary
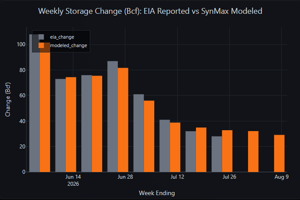
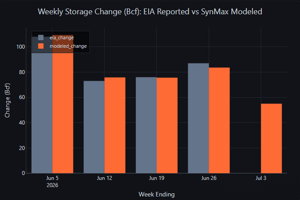
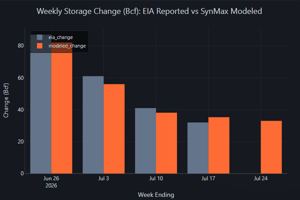
The four-week injection trajectory tells a clear story of market tightening: +83 → +61 → +41 → +36 Bcf. The EIA print for the week ending 7/10 came in at +41 Bcf, versus SynMax's modeled +36 Bcf — a -5 Bcf miss that extends the model's recent light bias and was likely driven by reduced demand related to the July 4th holiday. (SynMax's models have since been revised slightly and now point to a modeled 38.4 Bcf injection for the ending 7/10) Over the last four reported weeks the model's MAE is 2.9 Bcf, with a consistent -2.9 Bcf mean bias (model undershooting EIA).
At a modeled 3,060 Bcf, working gas inventories sit 15 Bcf below last year (3,075 Bcf) and 189 Bcf (+6.6%) above the 5-year average (2,871 Bcf). The year-over-year surplus has effectively closed from +87 Bcf in early June — a sign that strong production growth is being absorbed by even stronger demand growth on the margin.
|
Week Ending |
EIA (Bcf) |
Change (Bcf) |
Modeled Chg |
Status |
|
Jun 19 |
2,835 |
+76 |
+75.3 |
Reported |
|
Jun 26 |
2,922 |
+87 |
+82.5 |
Reported |
|
Jul 03 |
2,983 |
+61 |
+57.2 |
Reported |
|
Jul 10 |
3,024 |
+41 |
+38.4 |
Reported |
|
Jul 17 |
~3,060 |
TBD |
+35.6 |
SynMax |
Primary Driver: Power Burn Hits New Summer High (+2.1 Bcf/d WoW)
Gas-fired generation surged from 48.9 to 51.1 Bcf/d, setting the highest weekly average since at least summer 2025. The +2.1 Bcf/d increase extends a remarkable four-week ramp: 40.6 → 45.8 → 48.9 → 51.1 Bcf/d — a cumulative +10.5 Bcf/d. Year-over-year, power burn is running +1.4 Bcf/d (+2.9%) above the same week last year (49.6 Bcf/d).
Weather Context
National population-weighted cooling degree days (CDDs) rose modestly, with the Pacific region seeing a dramatic surge (+3.1 CDDs WoW) driven by an extended heat wave across California and the Desert Southwest. However, the South Central region — typically the largest driver of summer gas demand — actually saw CDDs decline by 3.4, partially offsetting the Pacific increase. This regional divergence is critical: the national CDD change understates the gas market impact because the Pacific runs a much more gas-heavy generation stack than regions where CDDs fell.
Renewable Generation Decline — The Hidden Driver
The power burn surge cannot be explained by weather alone. EIA-930 hourly generation data reveals a significant decline in renewable output that forced gas-fired generation to fill the gap. Over the two-week period from the week ending July 4 to the week ending July 17, total renewable generation (wind + solar + hydro) fell by approximately 3,008 GWh/day — equivalent to roughly 2.3 Bcf/d of displaced gas-fired backup.
National Generation Mix Shift (2-Week Change, WE 7/4 → WE 7/17)
|
Fuel |
WE 7/4 Share |
WE 7/17 Share |
2-Week Δ |
|
Natural Gas |
39.1% |
44.0% |
+4.9pp |
|
Wind |
11.7% |
6.6% |
-5.1pp |
|
Solar |
8.6% |
7.5% |
-1.1pp |
|
Coal |
16.9% |
18.8% |
+1.9pp |
|
Nuclear |
17.4% |
17.5% |
+0.1pp |
|
Hydro |
6.3% |
5.6% |
-0.7pp |
Gas's share of total generation jumped nearly 5 percentage points in two weeks, while wind collapsed from 11.7% to 6.6%. Coal also gained share (+1.9pp), indicating that both gas and coal were called upon to replace lost renewable output and serve incremental cooling load.
Regional ISO Dynamics
CAISO (California): Gas-fired generation nearly doubled (+119 GWh/d, +97%) as solar output fell 21% and wind dropped 37% during the Pacific heat wave. CAISO accounted for roughly 48% of the national increase in gas-fired generation despite representing only ~8% of total US capacity. California's gas-heavy marginal generation stack means that when renewables falter during heat events, gas bears a disproportionate share of the incremental load.
ERCOT (Texas): Solar fell 30% and wind declined 18%, but gas generation actually decreased 4% as lower South Central temperatures reduced total load. This demonstrates that falling CDDs can more than offset renewable declines when the temperature effect is large enough.
PJM / MISO: Renewable output held steady or increased slightly, muting gas burn gains despite rising CDDs in the East and Midwest. This contrast with CAISO reinforces that the renewable decline was regionally concentrated and amplified by the Pacific's generation mix.
For a detailed look at regional YoY renewable generation performance in July, check out this dashboard.
Weather-Adjusted Power Burn Residual
The weather-adjusted power burn residual — the gap between actual gas consumption for power and what CDDs alone would predict — widened to approximately +2.9 Bcf/d above the CDD-regression expectation (vs +1.3 Bcf/d the prior week). The renewable generation decline explains the bulk of this gap: national CDDs rose only modestly, but the simultaneous loss of ~3,008 GWh/d of renewable output meant gas had to absorb both incremental cooling demand AND the renewable shortfall. Regions with stable renewables (PJM) saw muted gas increases; regions with collapsing renewables (CAISO) saw explosive gains.
A more comprehensive looks at regional weather adjusted power burns is available here.
Secondary Factors
LNG Feedgas: Freeport Outage Provides Bearish Offset
Total LNG feedgas averaged 17.55 Bcf/d for the week, down 0.97 Bcf/d from the prior week's 18.52 Bcf/d. The decline was driven almost entirely by the Freeport LNG outage, where feedgas fell from ~2.1 Bcf/d to as low as 0.18 Bcf/d mid-week before partially recovering. Excluding Freeport, LNG feedgas was roughly flat. Sabine Pass remained the largest facility at ~4.6 Bcf/d, followed by Plaquemines (~3.8 Bcf/d) and Corpus Christi (~3.2 Bcf/d). Golden Pass continued its Stage 3 ramp at ~0.33 Bcf/d.
Canadian Imports
Canadian pipeline imports increased +0.36 Bcf/d to 9.28 Bcf/d, a modest supply-side positive that partially offset the power burn increase.
Mexican Exports
Pipeline exports to Mexico eased -0.20 Bcf/d to 6.94 Bcf/d, a small bearish contribution to the domestic balance.
Production
Dry gas production averaged 110.66 Bcf/d for the week, up +0.50 Bcf/d from the prior week's 110.16 Bcf/d. Production remains on a steady upward trend, running approximately +3.3 Bcf/d above year-ago levels. The modest weekly increase contributed ~3.5 Bcf of additional supply over the 7-day period.
Residential/Commercial & Industrial
Res/Com demand was essentially flat at 8.42 Bcf/d (combined Residential 3.55 + Commercial 4.87 Bcf/d). Industrial demand edged up +0.10 Bcf/d to 21.92 Bcf/d. Neither sector was a meaningful driver of the weekly balance change.
|
Factor |
WE 7/10 (Bcf/d) |
WE 7/17 (Bcf/d) |
Δ WoW |
Impact |
|
Production (Supply) |
110.16 |
110.66 |
+0.50 |
Bearish |
|
Electric Power |
48.94 |
51.05 |
+2.11 |
Bullish |
|
Industrial |
21.82 |
21.92 |
+0.10 |
Neutral |
|
Res/Com |
8.41 |
8.42 |
+0.01 |
Neutral |
|
LNG Feedgas |
18.52 |
17.55 |
-0.97 |
Bearish |
|
Mexico Exports |
7.14 |
6.94 |
-0.20 |
Bearish |
|
Canada Imports (Supply) |
-8.92 |
-9.28 |
-0.36 |
Bearish |
|
Canada Exports |
2.72 |
2.72 |
+0.00 |
Neutral |
|
Lease/Plant/Pipe/Vehicle |
8.35 |
8.48 |
+0.13 |
Neutral |
|
Balancing Factor |
-2.31 |
-2.21 |
+0.09 |
Neutral |
|
|
|
|
|
|
|
Net Demand |
104.67 |
105.58 |
+0.91 |
|
|
Implied Daily Surplus |
5.49 |
5.08 |
-0.41 |
|
|
Modeled Weekly Injection (Bcf) |
+38.4 |
+35.6 |
-2.8 |
|
Henry Hub Pricing Context
The August NYMEX contract (NGQ26) sold off sharply mid-week, falling from $3.27 on July 7 to $2.86 on July 16 — a 12.5% decline — before recovering to $2.91 by Friday. The selloff coincided with the Freeport outage and reflects the market pricing in reduced LNG demand. The dip below $3.00 should support coal-to-gas switching in the Midwest and Mountain regions, providing a floor under power burn even if temperatures moderate.
New Dataset Release: US Demand
SynMax has released a new US Gas Demand Dataset for our Hyperion Clients. It consists of a daily demand estimate, broken out by EIA gas storage region and by demand component.
It covers the four weather-driven end-use sectors (Residential, Commercial, Industrial, and Electric Power), built as an ensemble of pipeline flow data and weather-driven modeling, calibrated to EIA's monthly totals. It also includes LNG feedgas at all US liquefaction and regasification terminals, pipeline trade flows with Mexico and Canada, and supporting components like lease/plant fuel and pipeline/distribution use — giving a complete, regionally resolved daily picture of the lower-48 gas balance.
The data is currently out on query_datalinks and on Agents and will be rolled out to the SynMax frontend and the traditional API over the coming weeks. See here for overview and access methods, and here for full methodology and details.
As usual, contact support@synmax.com with questions.