Week Ending July 24, 2026 SynMax Analytics | Published July 29, 2026 Headline SynMax models a +33...
Weekly Storage and S/D Brief - week ending 7/31/2026
Headline
SynMax models a +32 Bcf injection for the week ending July 31, roughly in line with the prior week's EIA-reported +28 Bcf build. A mid-week heat pulse that drove national CDDs to 14.1 on July 27 pushed power burn back up +0.96 Bcf/d to 50.66 Bcf/d, but a +1.48 Bcf/d surge in dry gas production to 112.0 Bcf/d — the highest weekly average of the summer — more than offset the demand increase. If confirmed, storage would stand at approximately 3,116 Bcf — roughly 39 Bcf below last year's pace and +215 Bcf (+7.4%) above the 5-year average.
Review the full analysis on the dashboard.
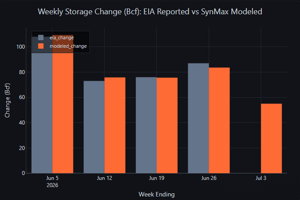
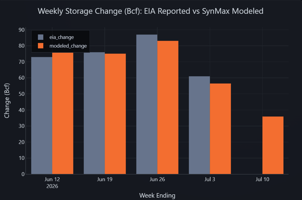
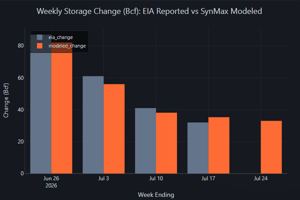
Model accuracy: Over the last 4 reported weeks, the SynMax model has averaged a mean absolute error (MAE) of 3.7 Bcf with a near-zero bias of +0.1 Bcf.
|
Week Ending |
EIA (Bcf) |
Model (Bcf) |
Error |
|
Jul 03 |
+61 |
+56.0 |
-5.0 |
|
Jul 10 |
+41 |
+38.8 |
-2.2 |
|
Jul 17 |
+32 |
+34.9 |
+2.9 |
|
Jul 24 |
+28 |
+32.8 |
+4.8 |
Primary Driver: Production Surge Offsets Returning Heat
The dominant feature of the week ending July 31 was a +1.48 Bcf/d increase in dry gas production to 112.03 Bcf/d — the highest weekly average of the summer and approximately +3.8 Bcf/d above year-ago levels (108.2 Bcf/d). This production surge provided the single largest supply-side tailwind, adding approximately 10.4 Bcf of additional supply over the 7-day period versus the prior week.
On the demand side, power burn bounced back +0.96 Bcf/d to 50.66 Bcf/d after easing the prior week, driven by a mid-week heat pulse. However, the production increase more than offset this demand recovery, keeping the net surplus roughly stable at 4.6 Bcf/d.
Weather Context
National population-weighted CDDs rose to 12.6 for the week (from 11.9 the prior week), driven by a mid-week heat event:
- July 26-27 saw the sharpest heat, with national CDDs hitting 13.4 and 14.1 respectively — the warmest readings in two weeks - July 29-30 brought relief as CDDs fell back to 11.8 and 11.4, indicating a brief cooldown before the weekend
The net effect was a modestly warmer week than the prior period, consistent with the +0.96 Bcf/d increase in power burn.
Secondary Factors
LNG Feedgas: Continued Climb to 18.35 Bcf/d
Total LNG feedgas averaged 18.35 Bcf/d for the week, up +0.25 Bcf/d from the prior week's 18.10 Bcf/d and +2.41 Bcf/d above year-ago levels (15.94 Bcf/d). Facility-level highlights:
- Freeport saw the largest weekly gain, averaging 1.79 Bcf/d (+0.27 WoW), continuing its recovery from earlier operational issues related to ongoing facility maintenance but still below its ~2.1 Bcf/d full-rate capacity.
- Plaquemines edged up to 3.81 Bcf/d (+0.06 WoW), remaining the second-largest facility.
- Sabine Pass eased slightly to 4.46 Bcf/d (-0.04 WoW) but remained the largest terminal
- Corpus Christi dipped to 3.22 Bcf/d (-0.04 WoW)
- Golden Pass pulled back modestly to 0.28 Bcf/d (-0.05 WoW) during its Stage 3 commissioning
Canadian Imports: Supply Recovery
Canadian pipeline imports recovered to -8.79 Bcf/d from -8.37 Bcf/d the prior week — an increase of 0.41 Bcf/d in supply.
Mexico Exports: Higher
Pipeline exports to Mexico increased +0.20 Bcf/d to 7.38 Bcf/d, consistent with continued summer heat driving Mexican power demand. This added ~1.4 Bcf of incremental demand.
Production: Summer High
Dry gas production averaged 112.03 Bcf/d for the week, up +1.48 Bcf/d from the prior week's 110.55 Bcf/d. Production continues to run approximately +3.8 Bcf/d above year-ago levels (108.2 Bcf/d in late July 2025), the widest YoY spread in several weeks.
Residential/Commercial & Industrial
Res/Com demand edged down slightly to 8.46 Bcf/d (-0.10 WoW), while Industrial demand was essentially flat at 21.96 Bcf/d (-0.06 WoW). Neither sector was a meaningful driver of the weekly balance.
Supply & Demand Factor Changes (WoW)
|
Factor |
WE 7/24 (Bcf/d) |
WE 7/31 (Bcf/d) |
Δ WoW |
Impact |
|
Production (Supply) |
110.55 |
112.03 |
+1.48 |
Bearish |
|
Electric Power |
49.69 |
50.66 |
+0.96 |
Bullish |
|
Industrial |
22.02 |
21.96 |
-0.06 |
Neutral |
|
Res/Com |
8.56 |
8.46 |
-0.10 |
Neutral |
|
LNG Feedgas |
18.10 |
18.35 |
+0.26 |
Bullish |
|
Mexico Exports |
7.18 |
7.38 |
+0.20 |
Bullish |
|
Canada Imports (Supply) |
-8.37 |
-8.79 |
-0.41 |
Bearish |
|
Canada Exports |
2.68 |
2.58 |
-0.09 |
Neutral |
|
Lease/Plant/Pipe/Vehicle |
8.28 |
8.42 |
+0.13 |
Neutral |
|
Balancing Factor |
-2.27 |
-1.57 |
+0.70 |
Bullish |
Outlook: Week Ending August 7
Early data for the week ending August 7 (5 of 7 days available) points to a slightly smaller injection of approximately +29 Bcf, driven by:
- Production pullback: Daily production has eased from the 112+ Bcf/d highs to around 110.8 Bcf/d in the August 1-5 window, giving back about half of last week's surge - LNG feedgas firm: Total feedgas has remained elevated in the 17.3-18.3 Bcf/d range, with Freeport continuing its gradual recovery - CDDs cooling: National CDDs have eased to approximately 12.0 through August 1-4, suggesting power burn may ease modestly from last week's 50.66 Bcf/d
Methodology & Data Sources
Storage change modeled as: Total Dry Gas Production (SUM across sub-regions) minus Total Net Demand (SUM of all demand types including Balancing Factor, for CONUS baseline scenarios), multiplied by 7 days. The Balancing Factor (-1.57 Bcf/d this week) represents the residual between independently modeled supply and demand components and is essential for calibrating the storage injection estimate against EIA actuals.
Data sources: SynMax daily production model (hdl.daily_production), SynMax demand model (hdl.gas_demand, baseline scenarios), SynMax LNG feedgas model (hdl.lng_feed_gas), EIA Weekly Natural Gas Storage Report, NOAA GFS/HRRR weather data (via local PostgreSQL).
Disclaimer: This report is produced by SynMax Analytics for informational purposes only. Modeled figures are estimates and may differ from official EIA releases. Past model accuracy does not guarantee future performance.
New Dataset Release: US Demand
SynMax has released a new US Gas Demand Dataset for our Hyperion Clients. It consists of a daily demand estimate, broken out by EIA gas storage region and by demand component.
It covers the four weather-driven end-use sectors (Residential, Commercial, Industrial, and Electric Power), built as an ensemble of pipeline flow data and weather-driven modeling, calibrated to EIA's monthly totals. It also includes LNG feedgas at all US liquefaction and regasification terminals, pipeline trade flows with Mexico and Canada, and supporting components like lease/plant fuel and pipeline/distribution use — giving a complete, regionally resolved daily picture of the lower-48 gas balance.
The data is currently out on query_datalinks and on Agents and will be rolled out to the SynMax frontend and the traditional API over the coming weeks. See here for overview and access methods, and here for full methodology and details.
As usual, contact support@synmax.com with questions.