
Each month we update and recalibrate our production and demand models as new state production and EIA demand data is published. This month we are also rolling out our new, fundamentals driven, long term electric power forecast model.
Demand model recalibrations
Nowcast
The EIA published its monthly demand data through August 2026, we have updated our demand models accordingly. Electric power burns were slightly higher than we had modelled, as was industrial demand.
| Sector | EIA Actual (Bcf/d) | SynMax Predicted (Bcf/d) |
Difference (Bcf/d) |
| Residential | 3.31 | 3.43 | 0.12 |
| Commercial | 4.80 | 4.85 | 0.05 |
| Industrial | 22.54 | 22.04 | -0.50 |
| Electric Power | 50.08 | 48.96 | -1.12 |
| L48 total | 80.73 | 79.28 | -1.45 |
As a result this month's recalibration resulted in a +0.2 Bcf/d increase in our power burn nowcast from August and a +0.1 Bcf/d increase in our modelled Industrial demand since August.
Forecast
New Electric Power Burn Model
Over the next several years, burn will be driven by things a trend cannot see: data centers connecting, new solar and wind, and coal competing with gas at forward prices. So, where our previous power burn model extended a trend fitted to EIA history, this new model builds burn from fundamental drivers, region by region. Specifically, we are now incorporating our own satellite tracking of power projects alongside utilities’ filed forecasts and their recent track record in projecting load growth. This approach has increased our winter power burn demand outlook by roughly 1.5 Bcf/d for November-January. Beyond this winter, the new model reduces our 2027 injection season burn levels modestly as renewable generation capacity is added to the power stack. A more detailed description of the power burn modeling changes will be published shortly.
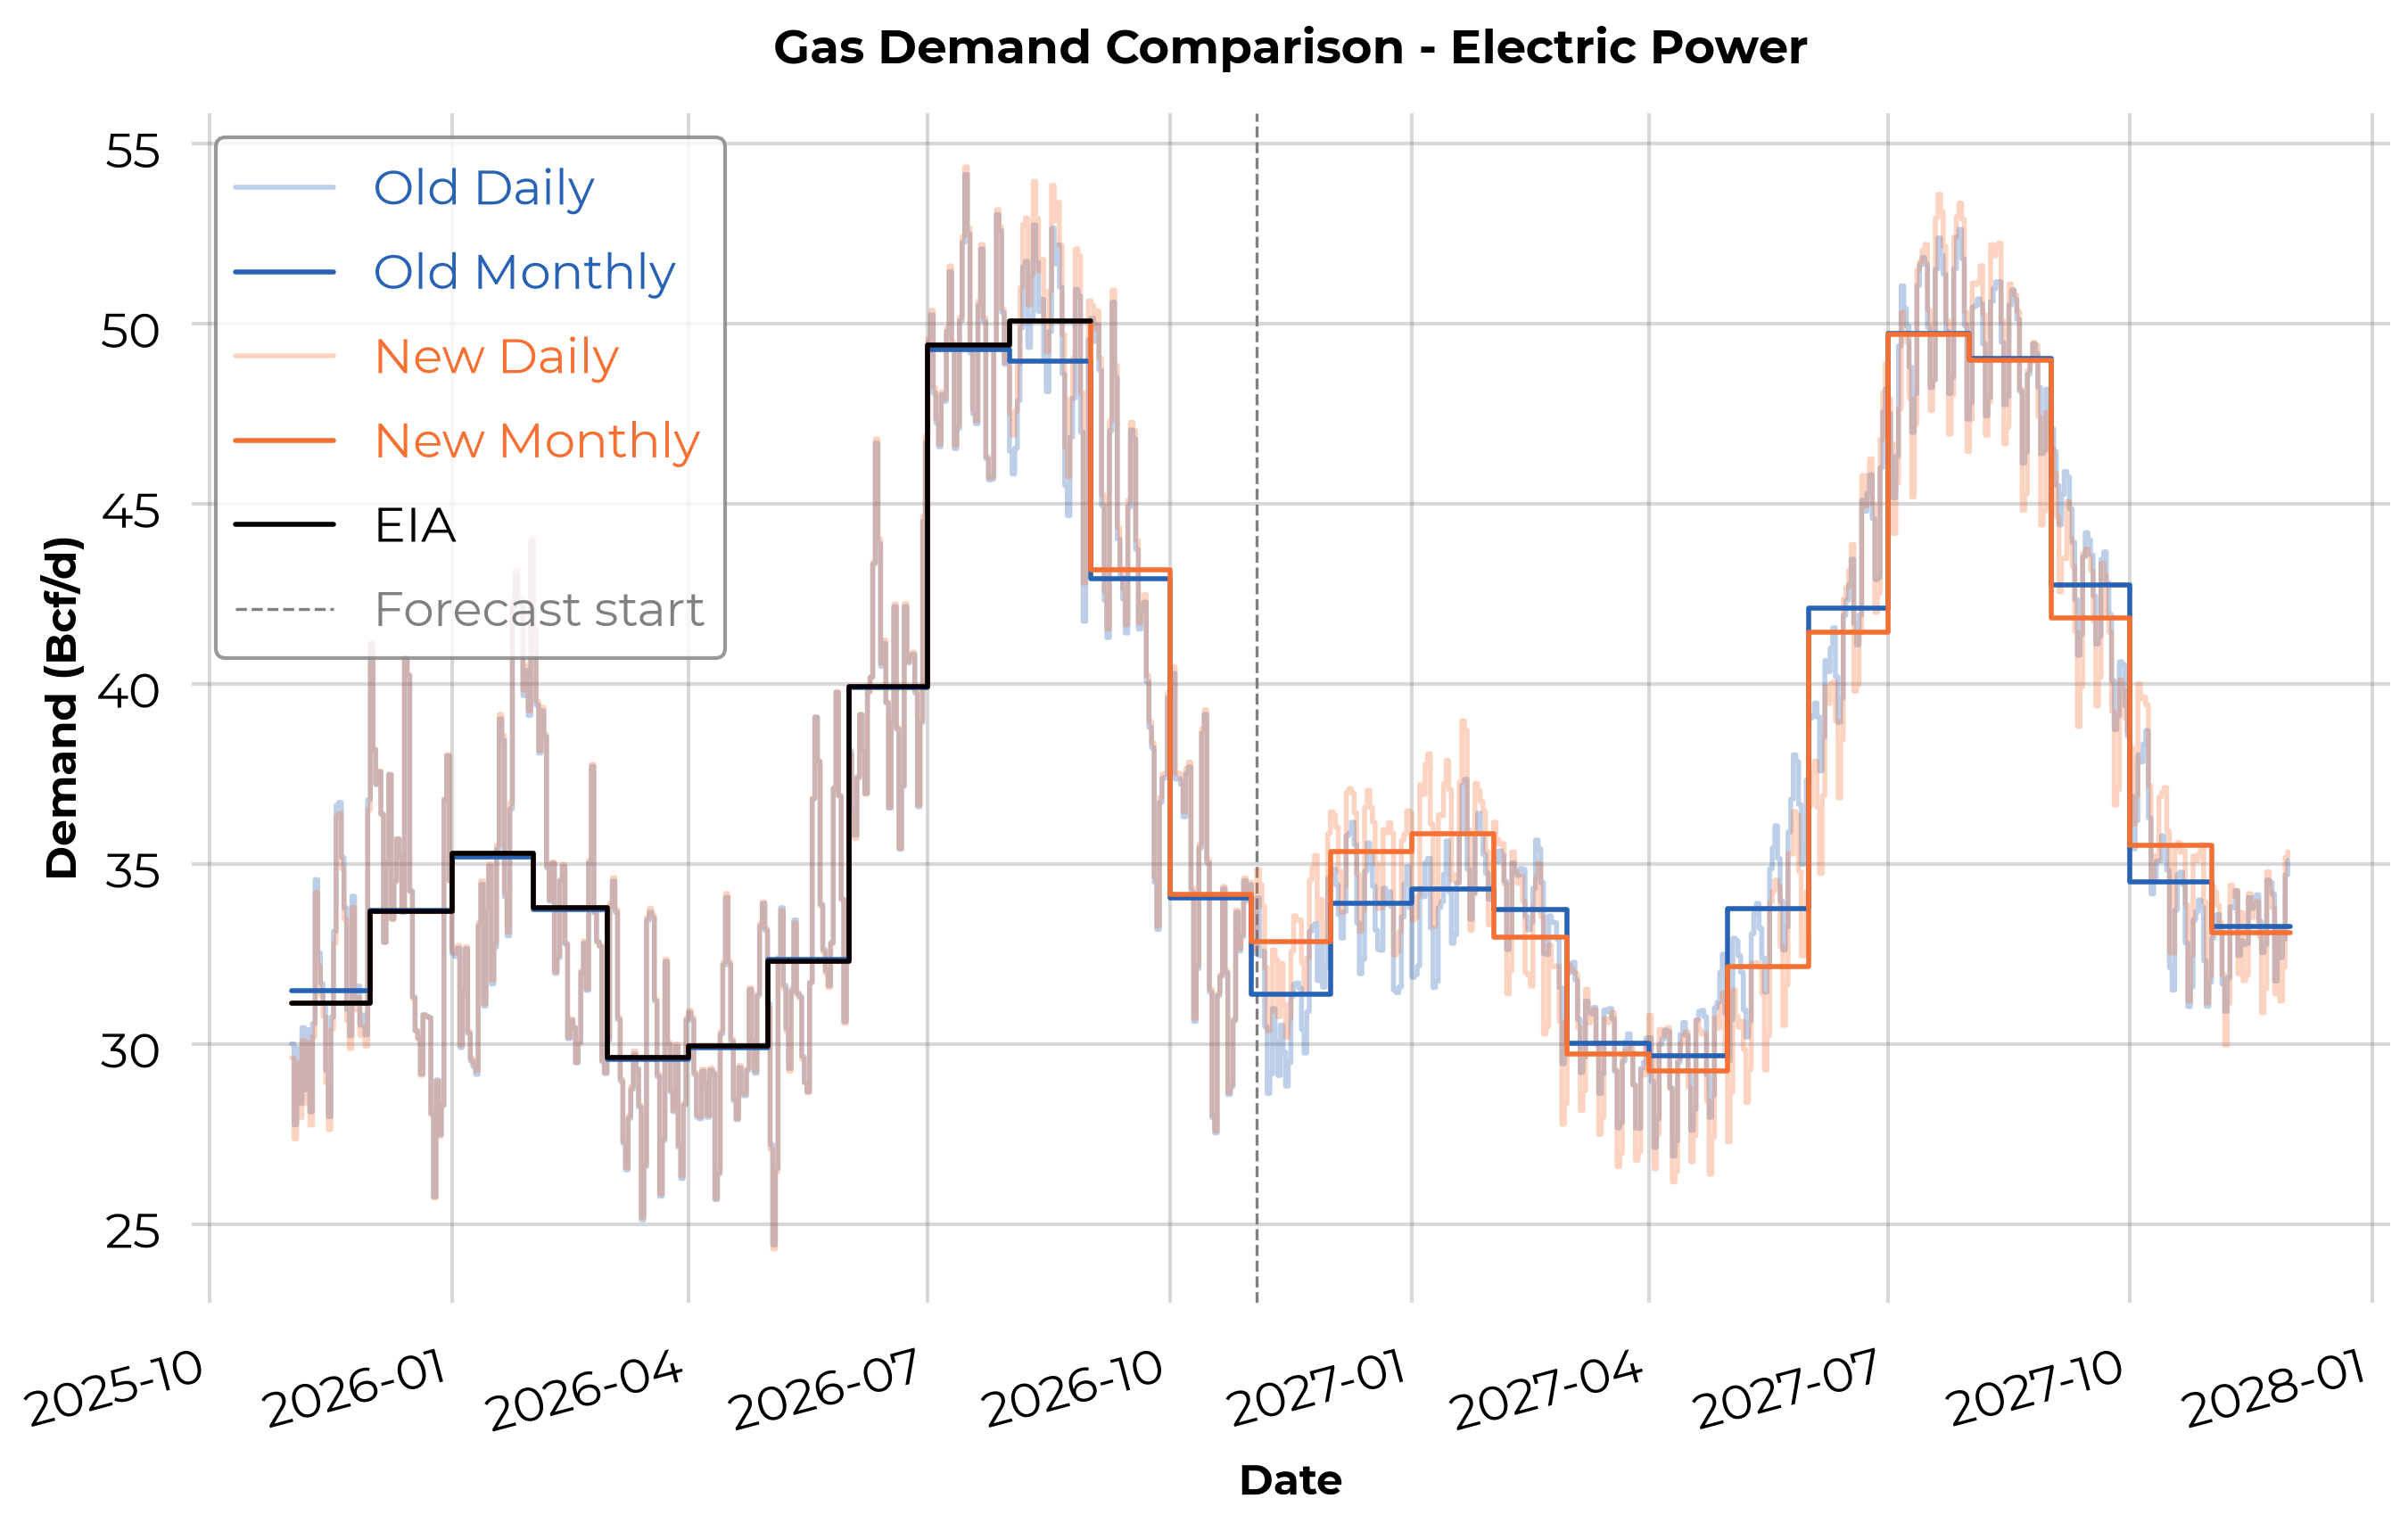
In addition to these structural power burn modeling changes, SynMax has also updated it's weighting of historical temperatures used for deriving its degree day dataset. This is a one-time fix and should not be expected to occur again in the future. However, it does impact the training of our weather-related demand forecast models and their output. The comprehensive changes of the three primary demand components are shown in the chart below.
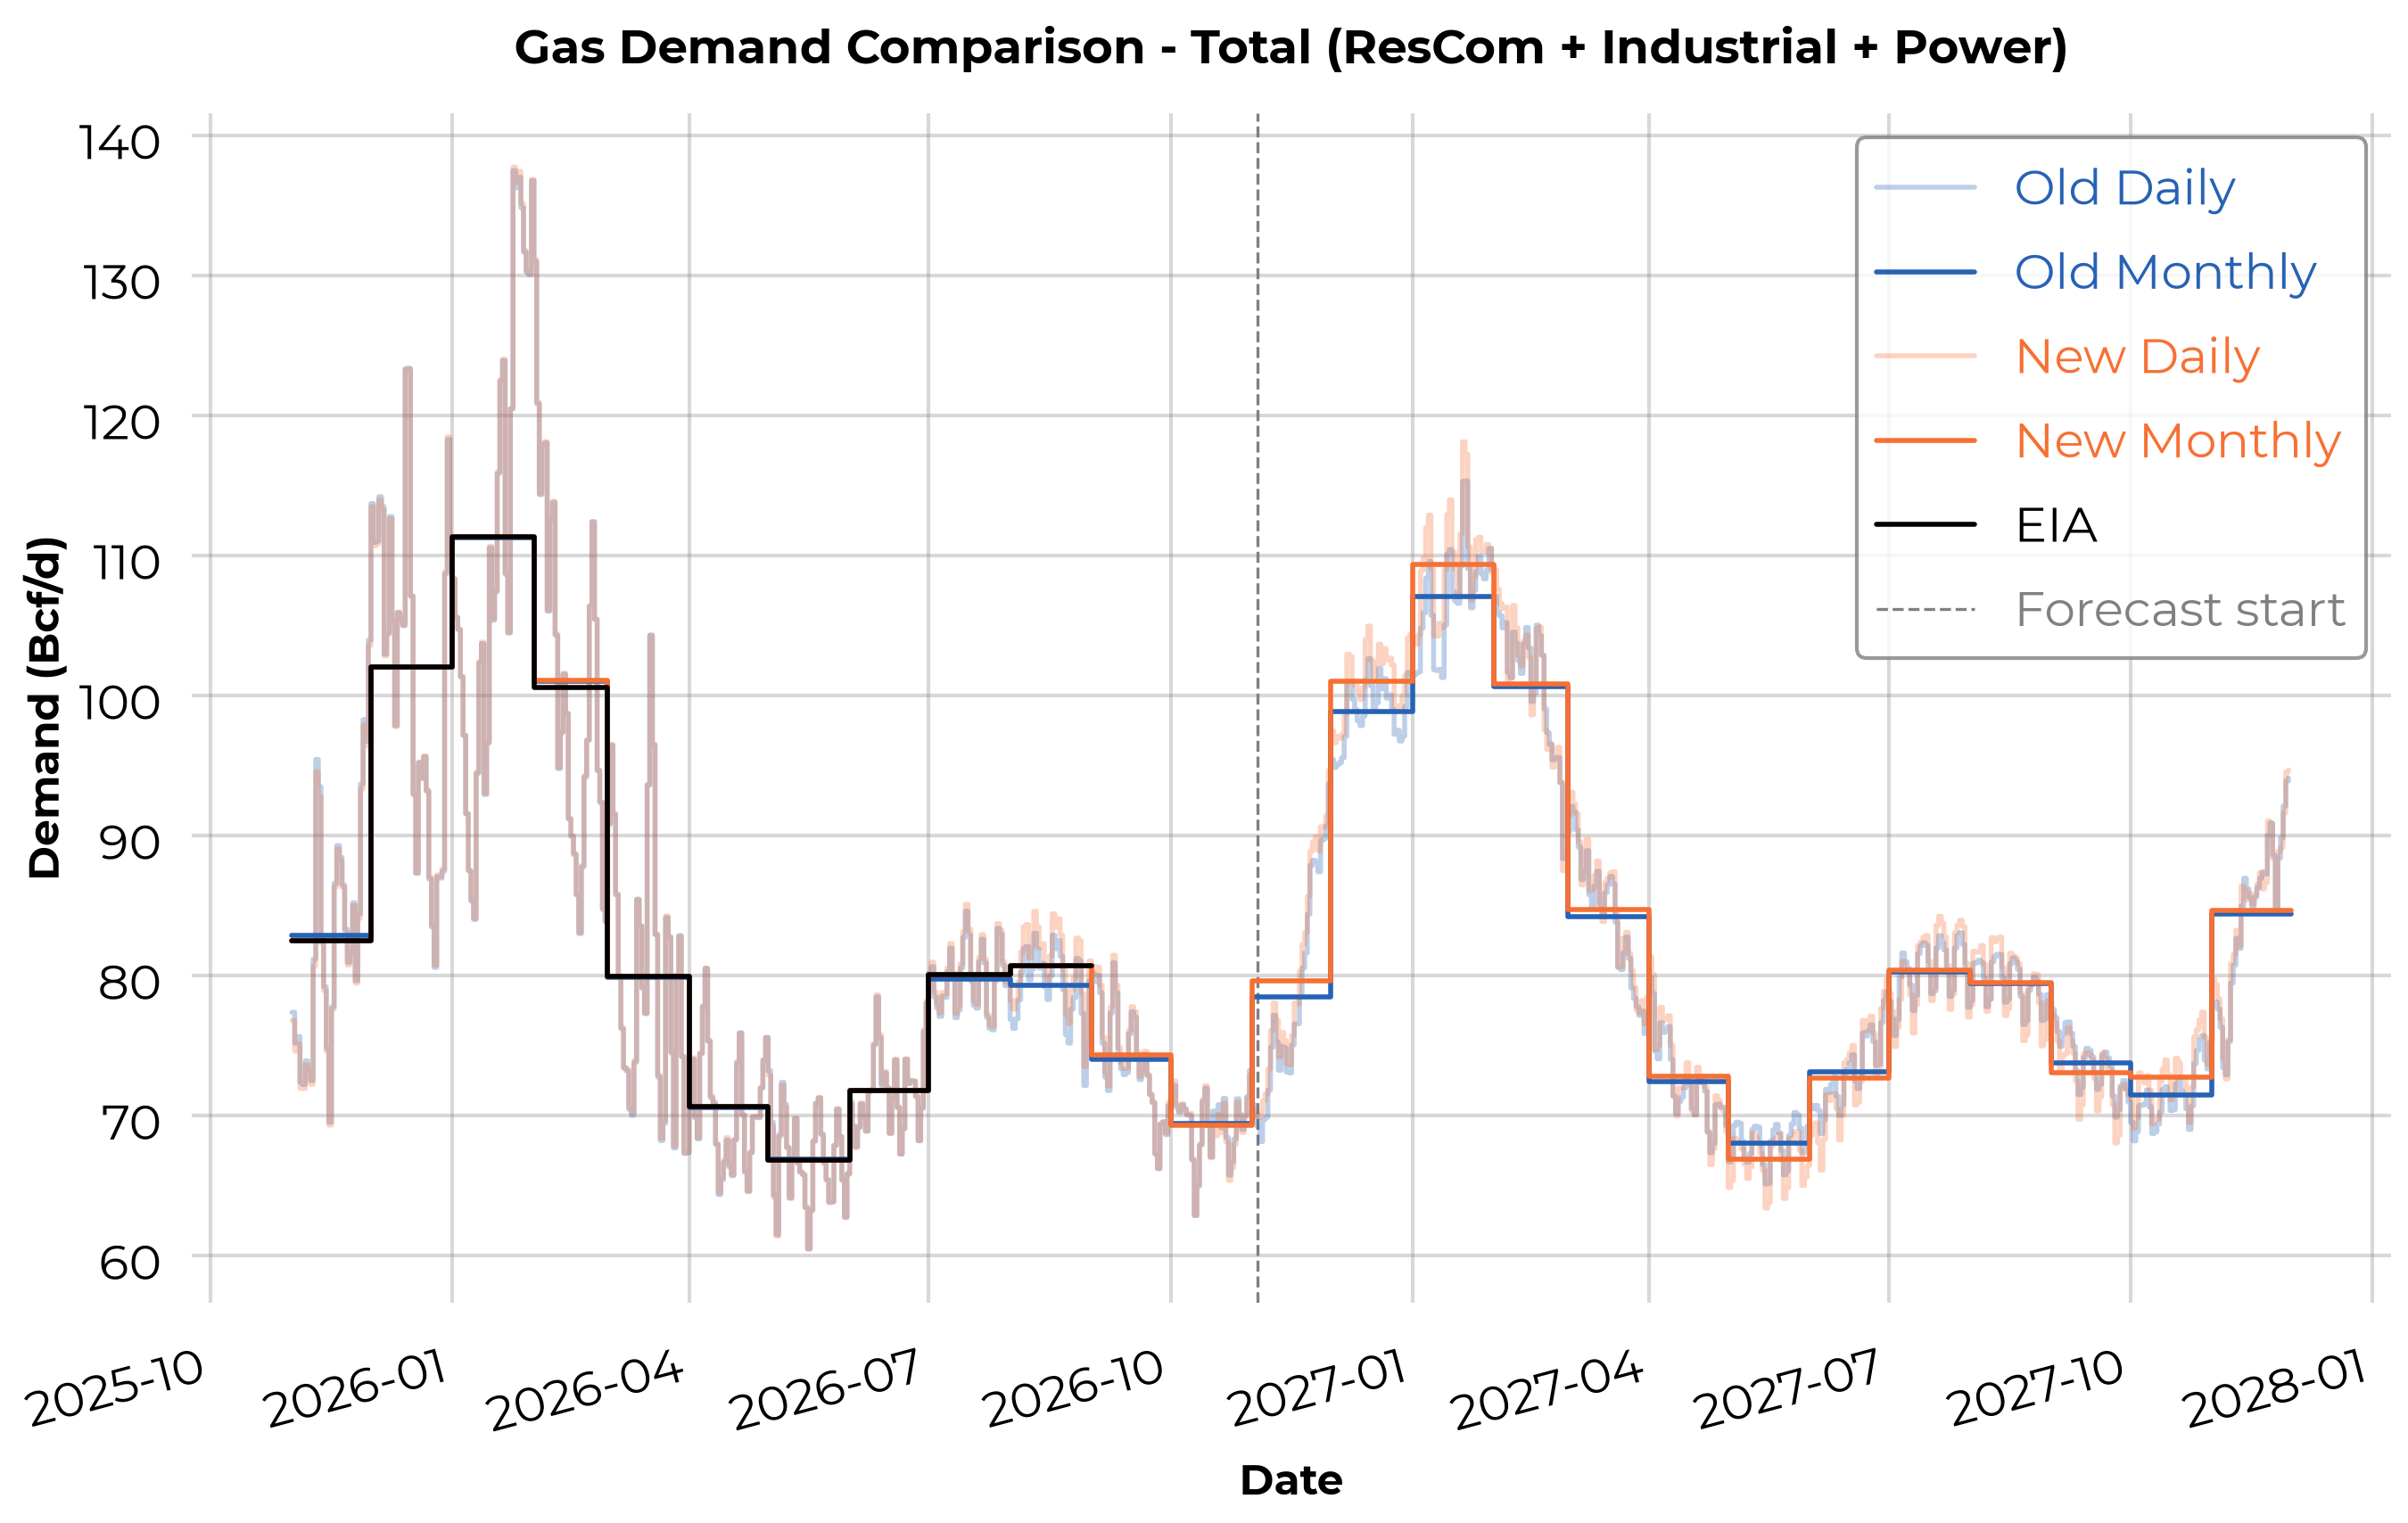
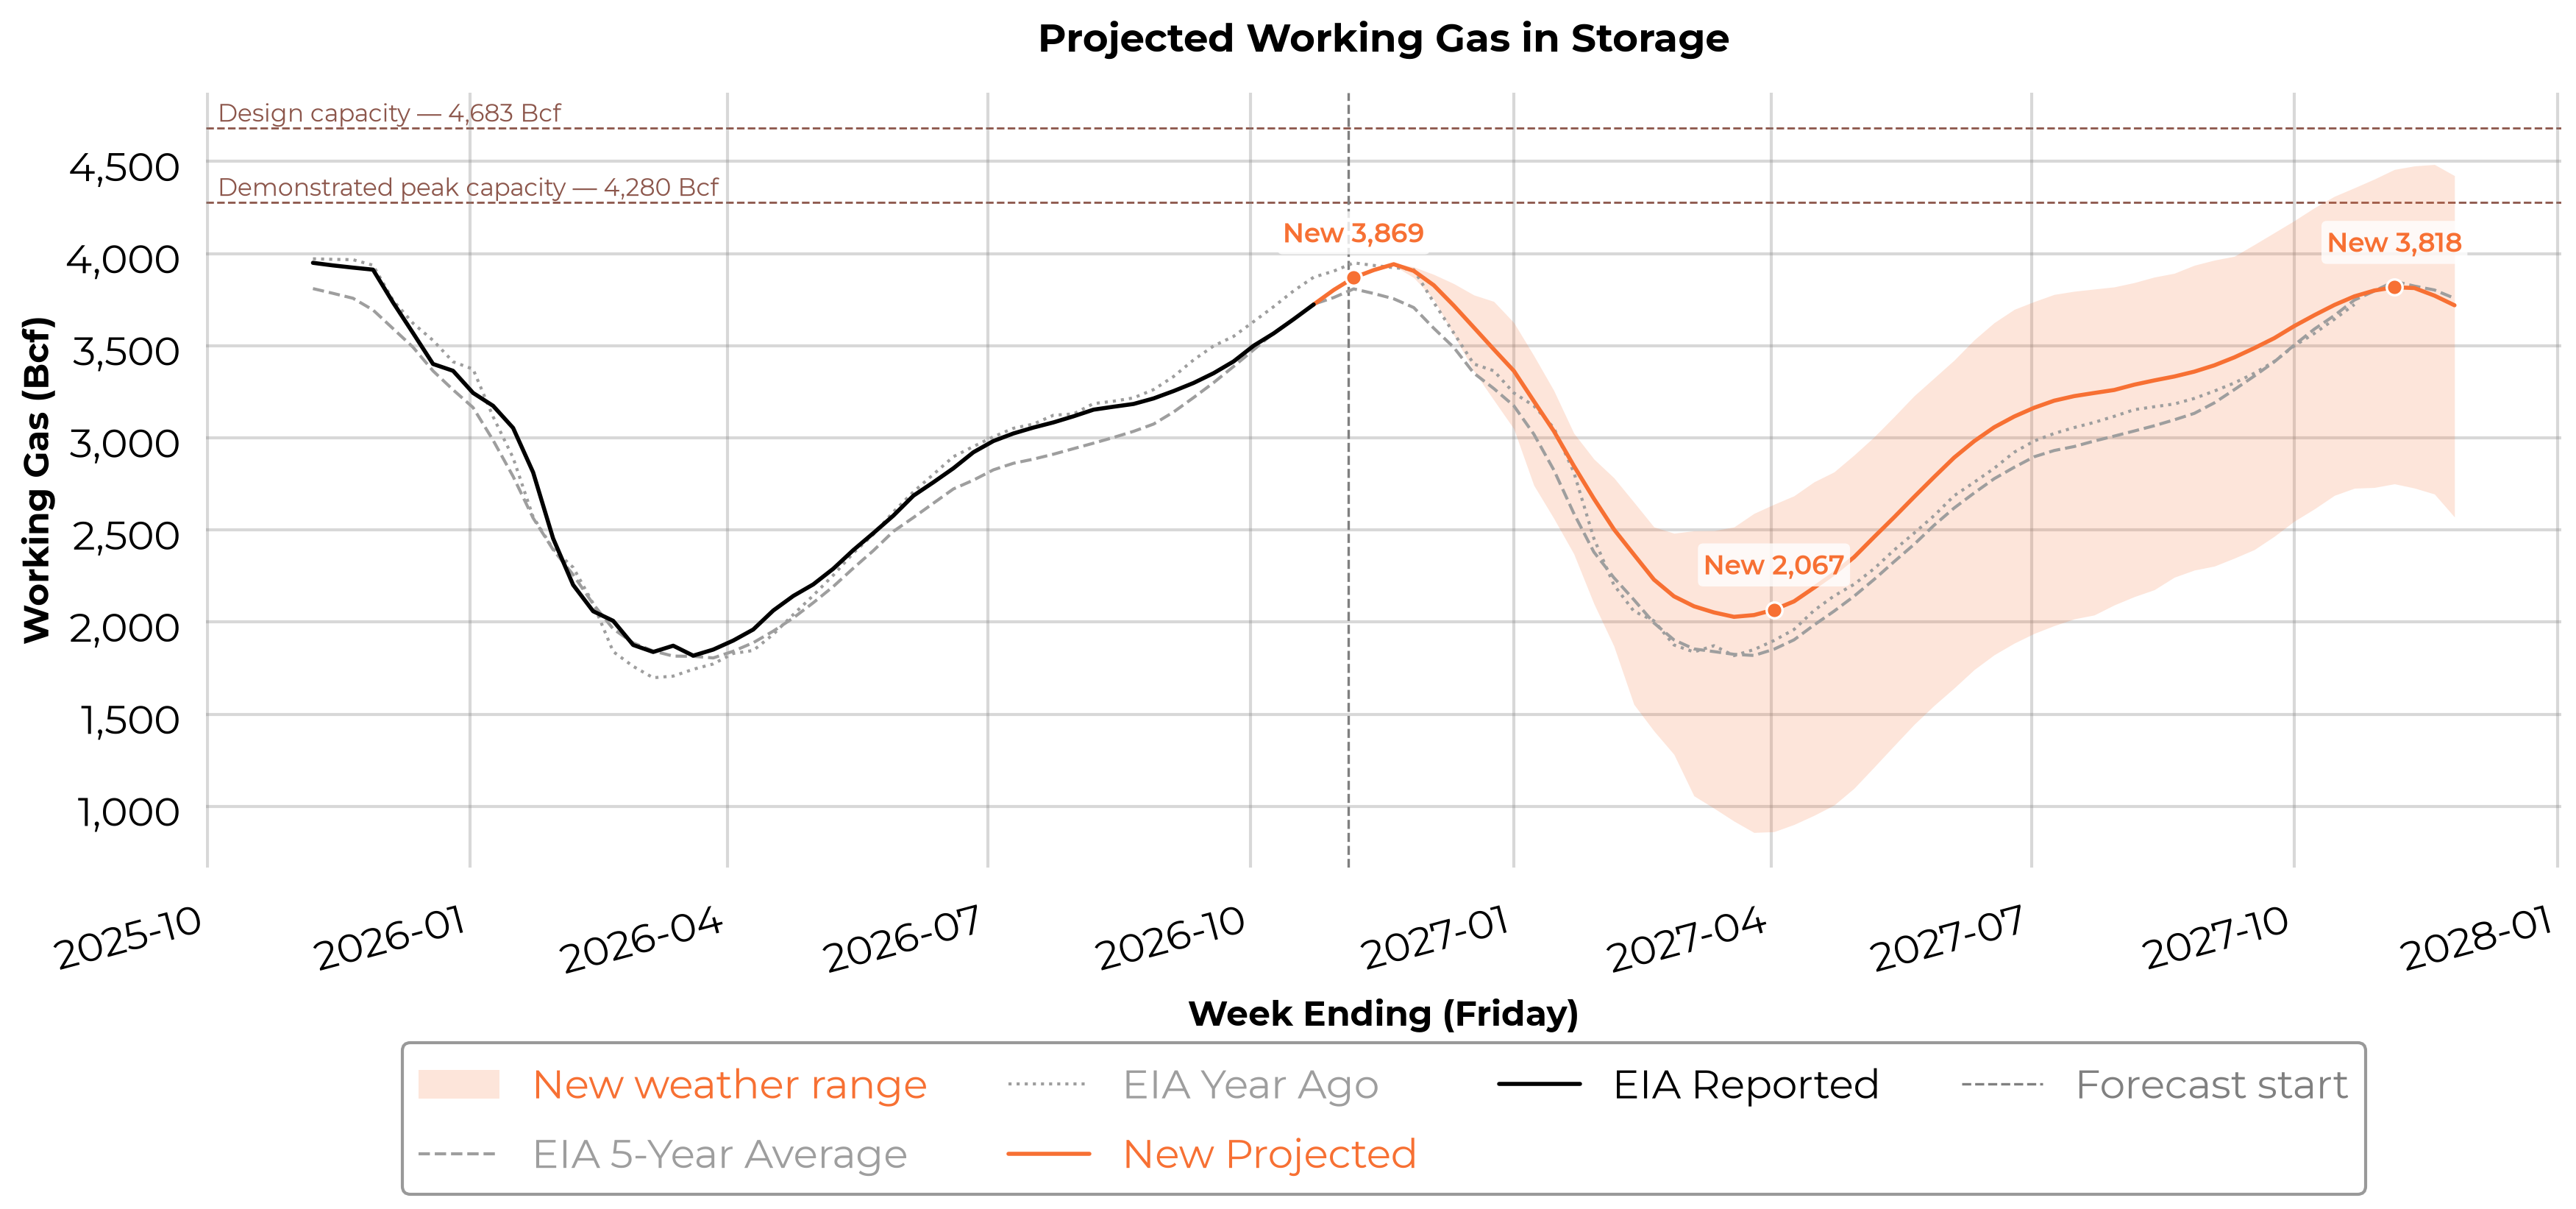
Ultimately, the net of these changes has reduced our baseline end of withdrawal season storage projections to 2.07 Tcf as of this morning. Our baseline end of 2027 injection season estimate currently is little changed at 3.82 Tcf.
Storage Chart through Oct 2027
Daily Production Update
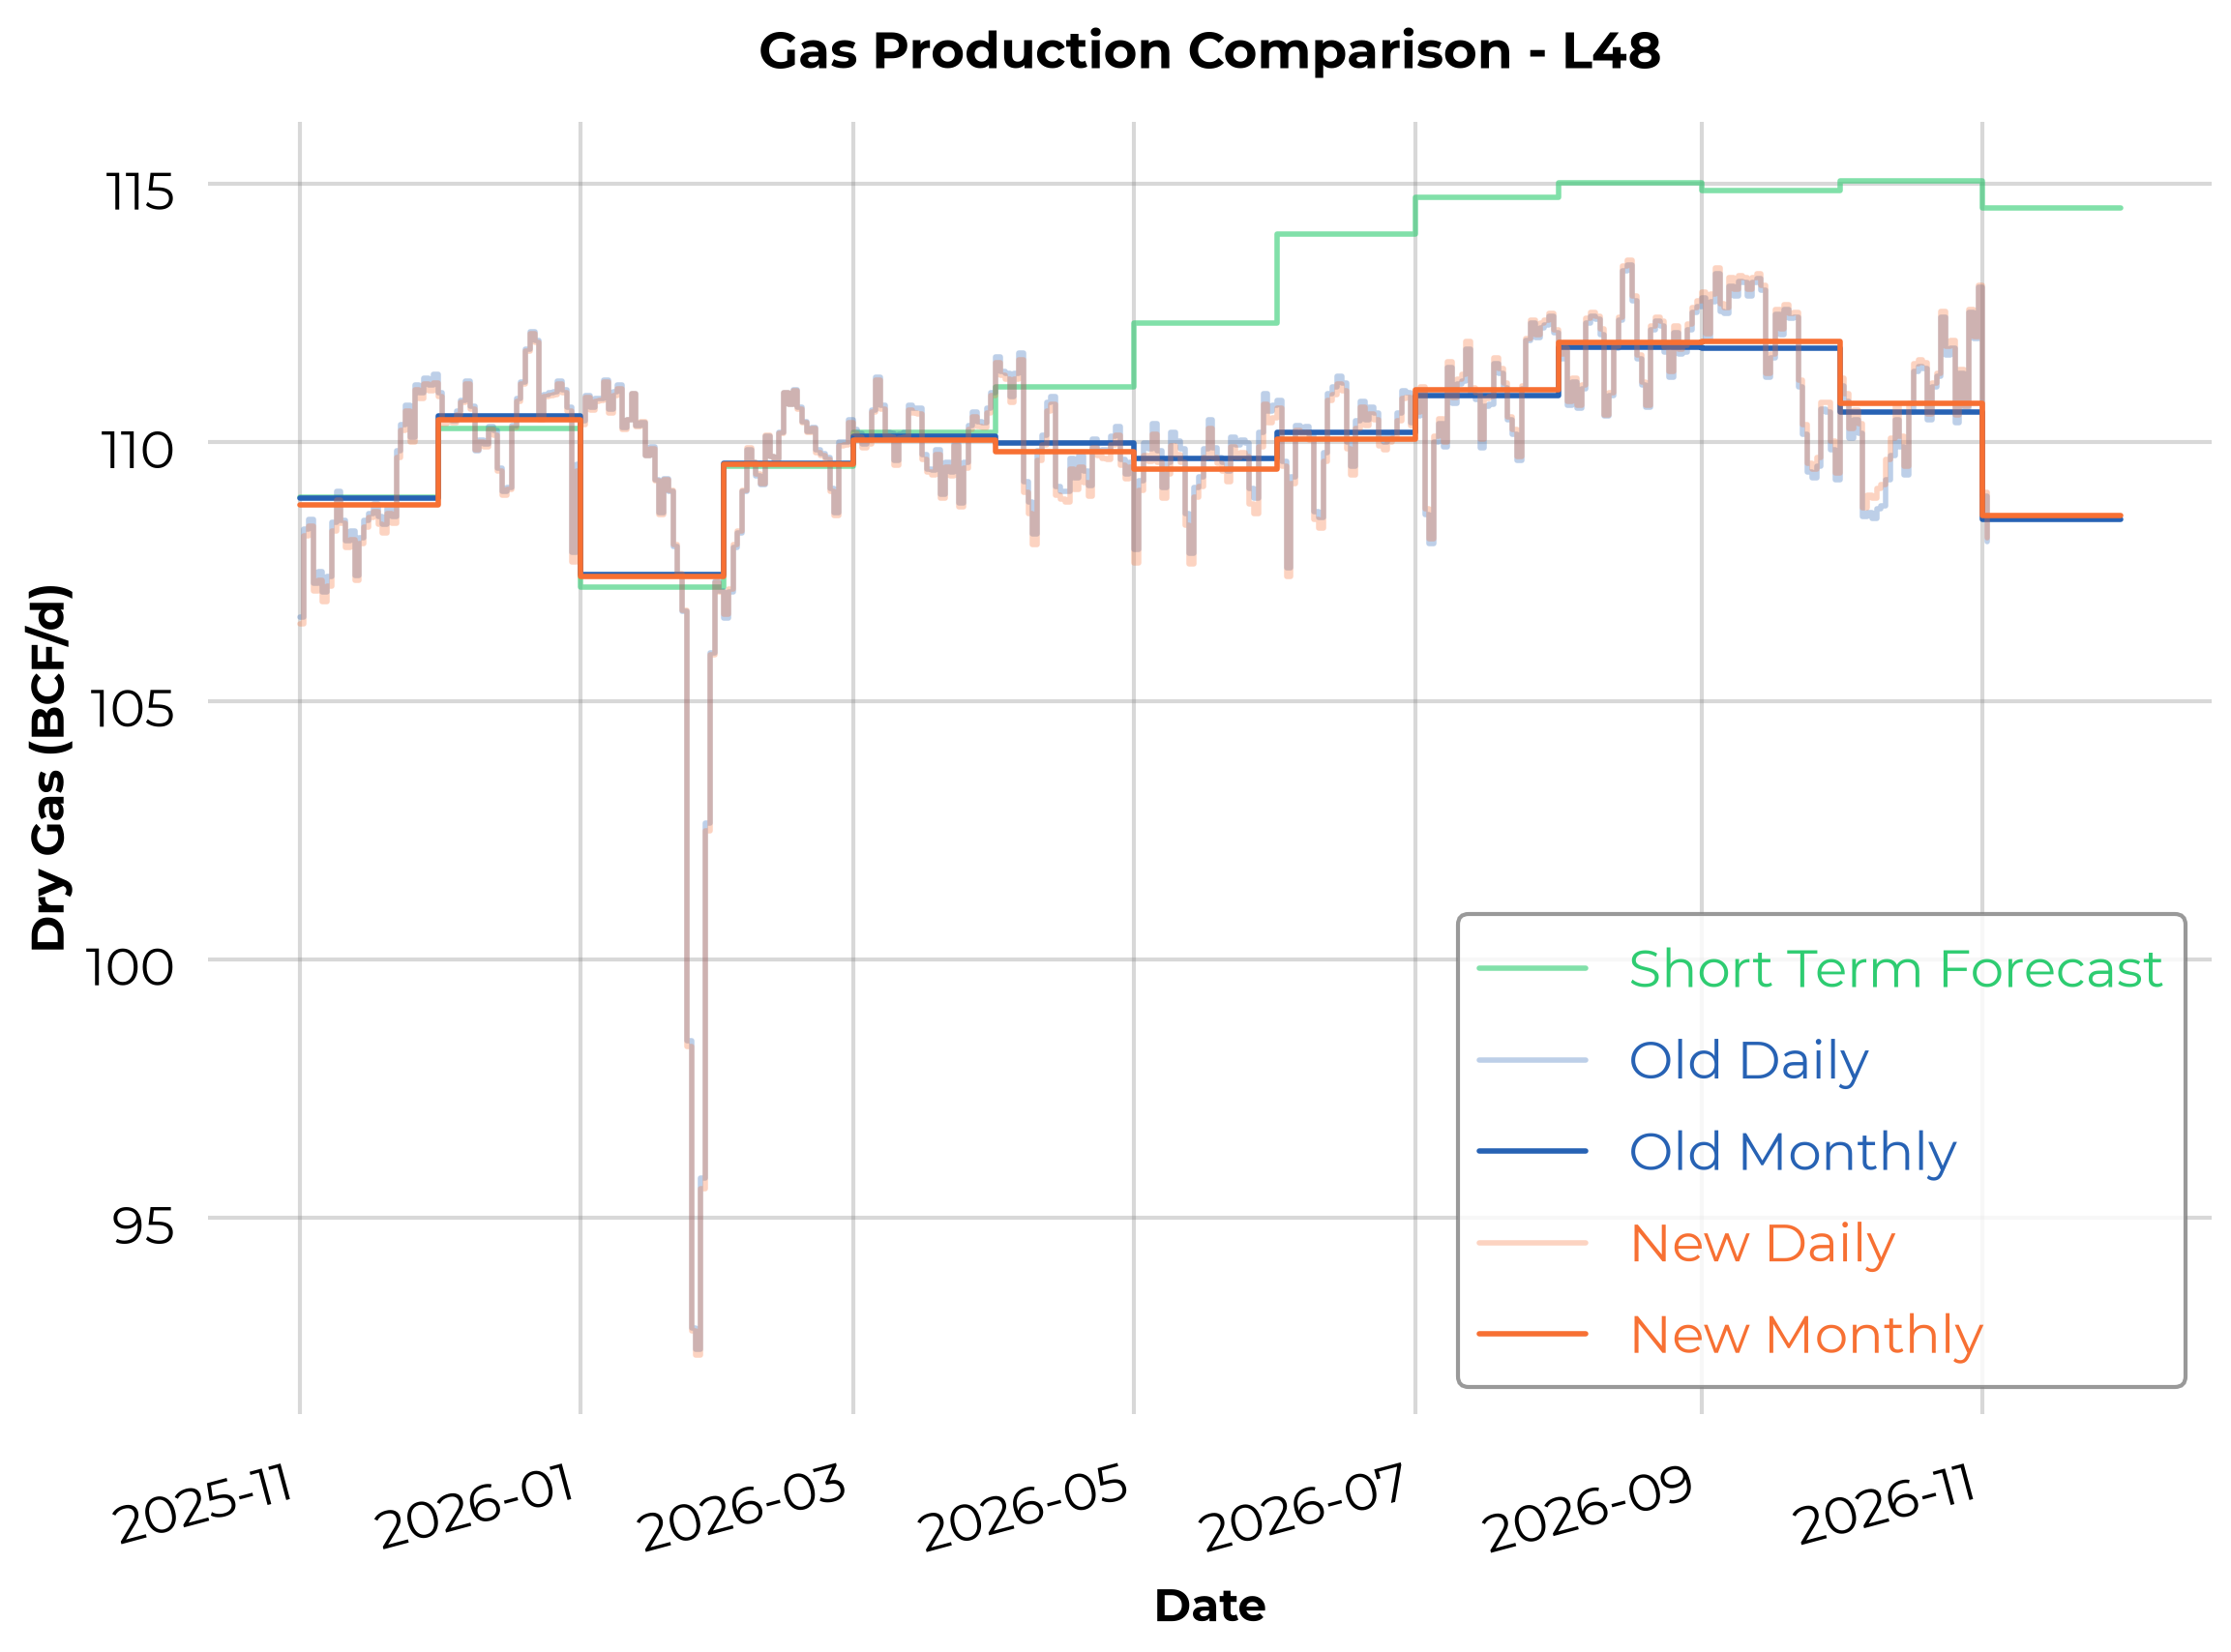
This month's production update is a modest one. We refreshed our regressions against the latest state-reported data, and our existing model continues to track well across almost every subregion. The changes will go live the morning of 3 November 2026.
L48 Changes
The update has no material affect on our modelled L48 production level. A small increase in modelled Permian production of +0.12 bcf/d was mostly offset by a small (-0.07 Bcf/d) decrease in modelled offshore Gulf production.
Appendix: Updated Alignment Dates
When fitting our daily production estimates, we consider two key dates for each subregion:
- State alignment cutoff: the date up to which we align our daily production estimates to state-reported production. On this day and prior the daily production model monthly averages are guaranteed to match state data.
- Last fitted date (or "last good" date): the date up to which we regress against the state data. The last fitted date can sometimes extend beyond the state alignment cutoff — this occurs when we are modeling reporting delays and therefore fitting against our own version of the state data (as discussed here).
The current alignment dates by subregion are shown below:
| Sub Region | Last Fitted Date | State Alignment Cutoff |
| Wyoming | 01-Jun-26 | 01-Jun-26 |
| WV | 01-Dec-25 | 01-Nov-25 |
| West - TX | 01-Jun-26 | 01-Dec-25 |
| SW PA | 01-Jul-26 | 01-Jul-26 |
| South - TX | 01-Jun-26 | 01-Nov-25 |
| SanJuan-CO | 01-Jul-26 | 01-Jul-26 |
| S LA | 01-May-26 | 01-Feb-26 |
| Permian-NM | 01-Jul-26 | 01-Jun-26 |
| OK | 01-Jun-26 | 01-Jun-26 |
| OH | 01-Jun-26 | 01-Nov-24 |
| North Dakota | 01-Jul-26 | 01-Jul-26 |
| North - TX | 01-May-26 | 01-May-26 |
| NewMexico | 01-Jul-26 | 01-Jul-26 |
| NE PA | 01-Jul-26 | 01-Jul-26 |
| N LA | 01-May-26 | 01-Jun-26 |
| MS | 01-Dec-25 | 01-Nov-25 |
| MI | 01-Nov-22 | 01-Nov-22 |
| KS | 01-Mar-26 | 01-Dec-25 |
| Haynesville - TX | 01-Apr-26 | 01-Jan-26 |
| Haynesville - LA | 01-May-26 | 01-Dec-25 |
| GOM | 01-Jun-26 | 01-Jun-26 |
| Colorado wo SJ | 01-Jun-26 | 01-May-26 |
| Central - TX | 01-Dec-25 | 01-Dec-25 |
| AR | 01-Dec-25 | 01-Dec-25 |
| AL | 01-Oct-22 | 01-Oct-22 |