Daily Production Update
This month's update is another light one. We have refreshed our regressions against the latest state-reported data, and our existing model continues to track well across almost every subregion. The one change worth calling out is a reallocation of production between two Texas subregions: volumes that had been attributed to Central Texas are now assigned to West Texas. These changes will be live the morning of 22 May 26.
L48 Changes
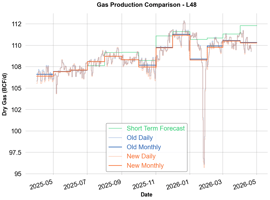
At the L48 level, the effect is small. Our production estimate has been revised down by an average of 0.02 Bcf/d since July 2025, and the current-day estimate has increased by 0.03 Bcf/d. This is essentially a wash: the Central-to-West Texas reallocation is a transfer *between* subregions, so it very nearly cancels at the L48 total, as the Old and New lines below show sitting almost on top of one another.
The short-term forecast (STF) is worth dwelling on this month, because it has pulled visibly away from the nowcast. The STF estimates total production capacity in a frictionless grid, so the gap between it and actual daily/monthly production is informative in its own right: it shows where real-world frictions such as maintenance, deferred flow, or pipeline constraints are holding volumes back. As the chart shows, that gap was modest through late 2025 but has widened steadily since around March 2026, with the STF now running well above realized production.
The Appalachian subregions account for over half of it. West Virginia leads at 0.71 Bcf/d, followed by NE Pennsylvania (0.53 Bcf/d, against an 11.93 Bcf/d STF) and Ohio (0.51 Bcf/d), a combined 1.97 Bcf/d. These reflect maintenance and Northeast producers deferring flow or choking back newly TILed wells. The Haynesville contributes 0.67 Bcf/d (LA 0.38 Bcf/d against an 11.51 Bcf/d STF; TX 0.29 Bcf/d), mainly maintenance. Permian-NM adds 0.47 Bcf/d (against a 10.46 Bcf/d STF), reflecting both maintenance and a shortage of pipeline capacity. The West Texas gap, by contrast, has now closed, consistent with the Gulf Coast Express expansion and the Hugh Brinson pipeline, which has flowed some production since roughly mid-June 2026.
Because the STF reflects capacity, the gap also indicates how much constrained supply is likely to return: we expect it to close by December 2026, as Northeast producers stop deferring and choking back wells, maintenance eases, Hugh Brinson ramps up, and the Blackcomb pipeline comes online.
Notable Subregion Changes
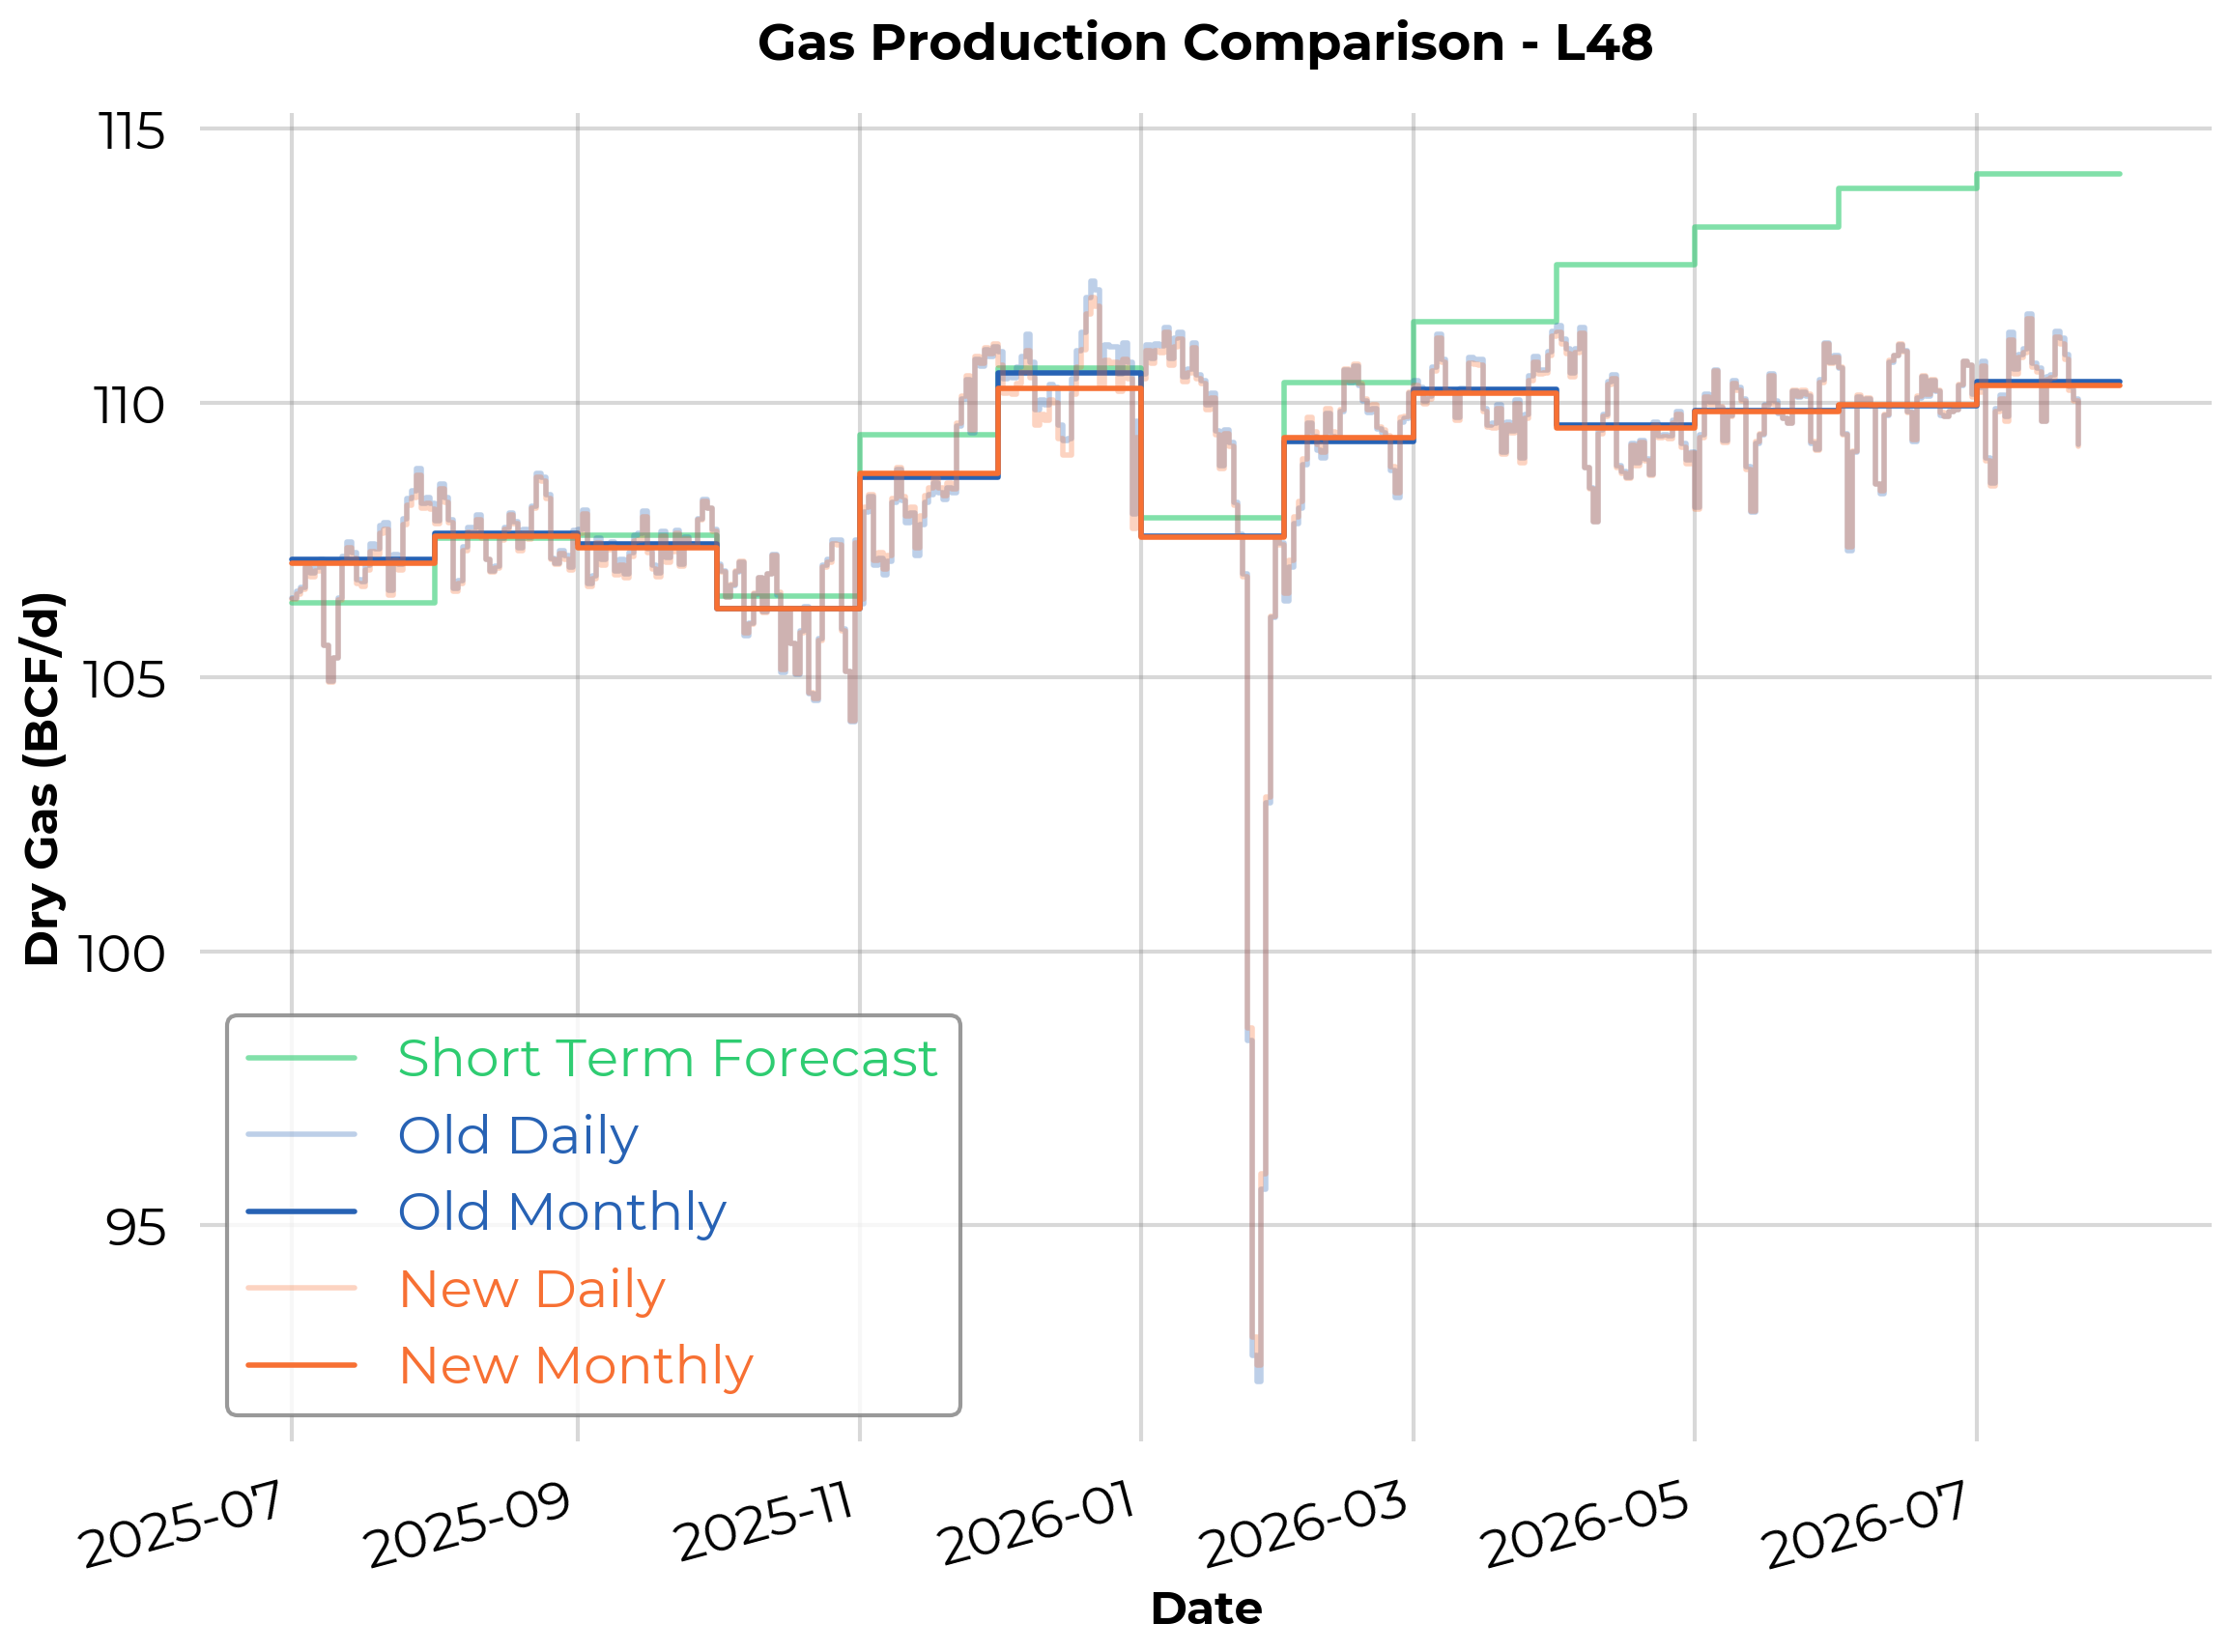
West Texas
West Texas has been revised upward by an average of 0.09 Bcf/d (0.05 Bcf/d on the current day), reflecting production that is now correctly attributed to West Texas rather than Central Texas. Production steps up to meet the forecast at the end of July, closing the gap here as new takeaway capacity begins to flow.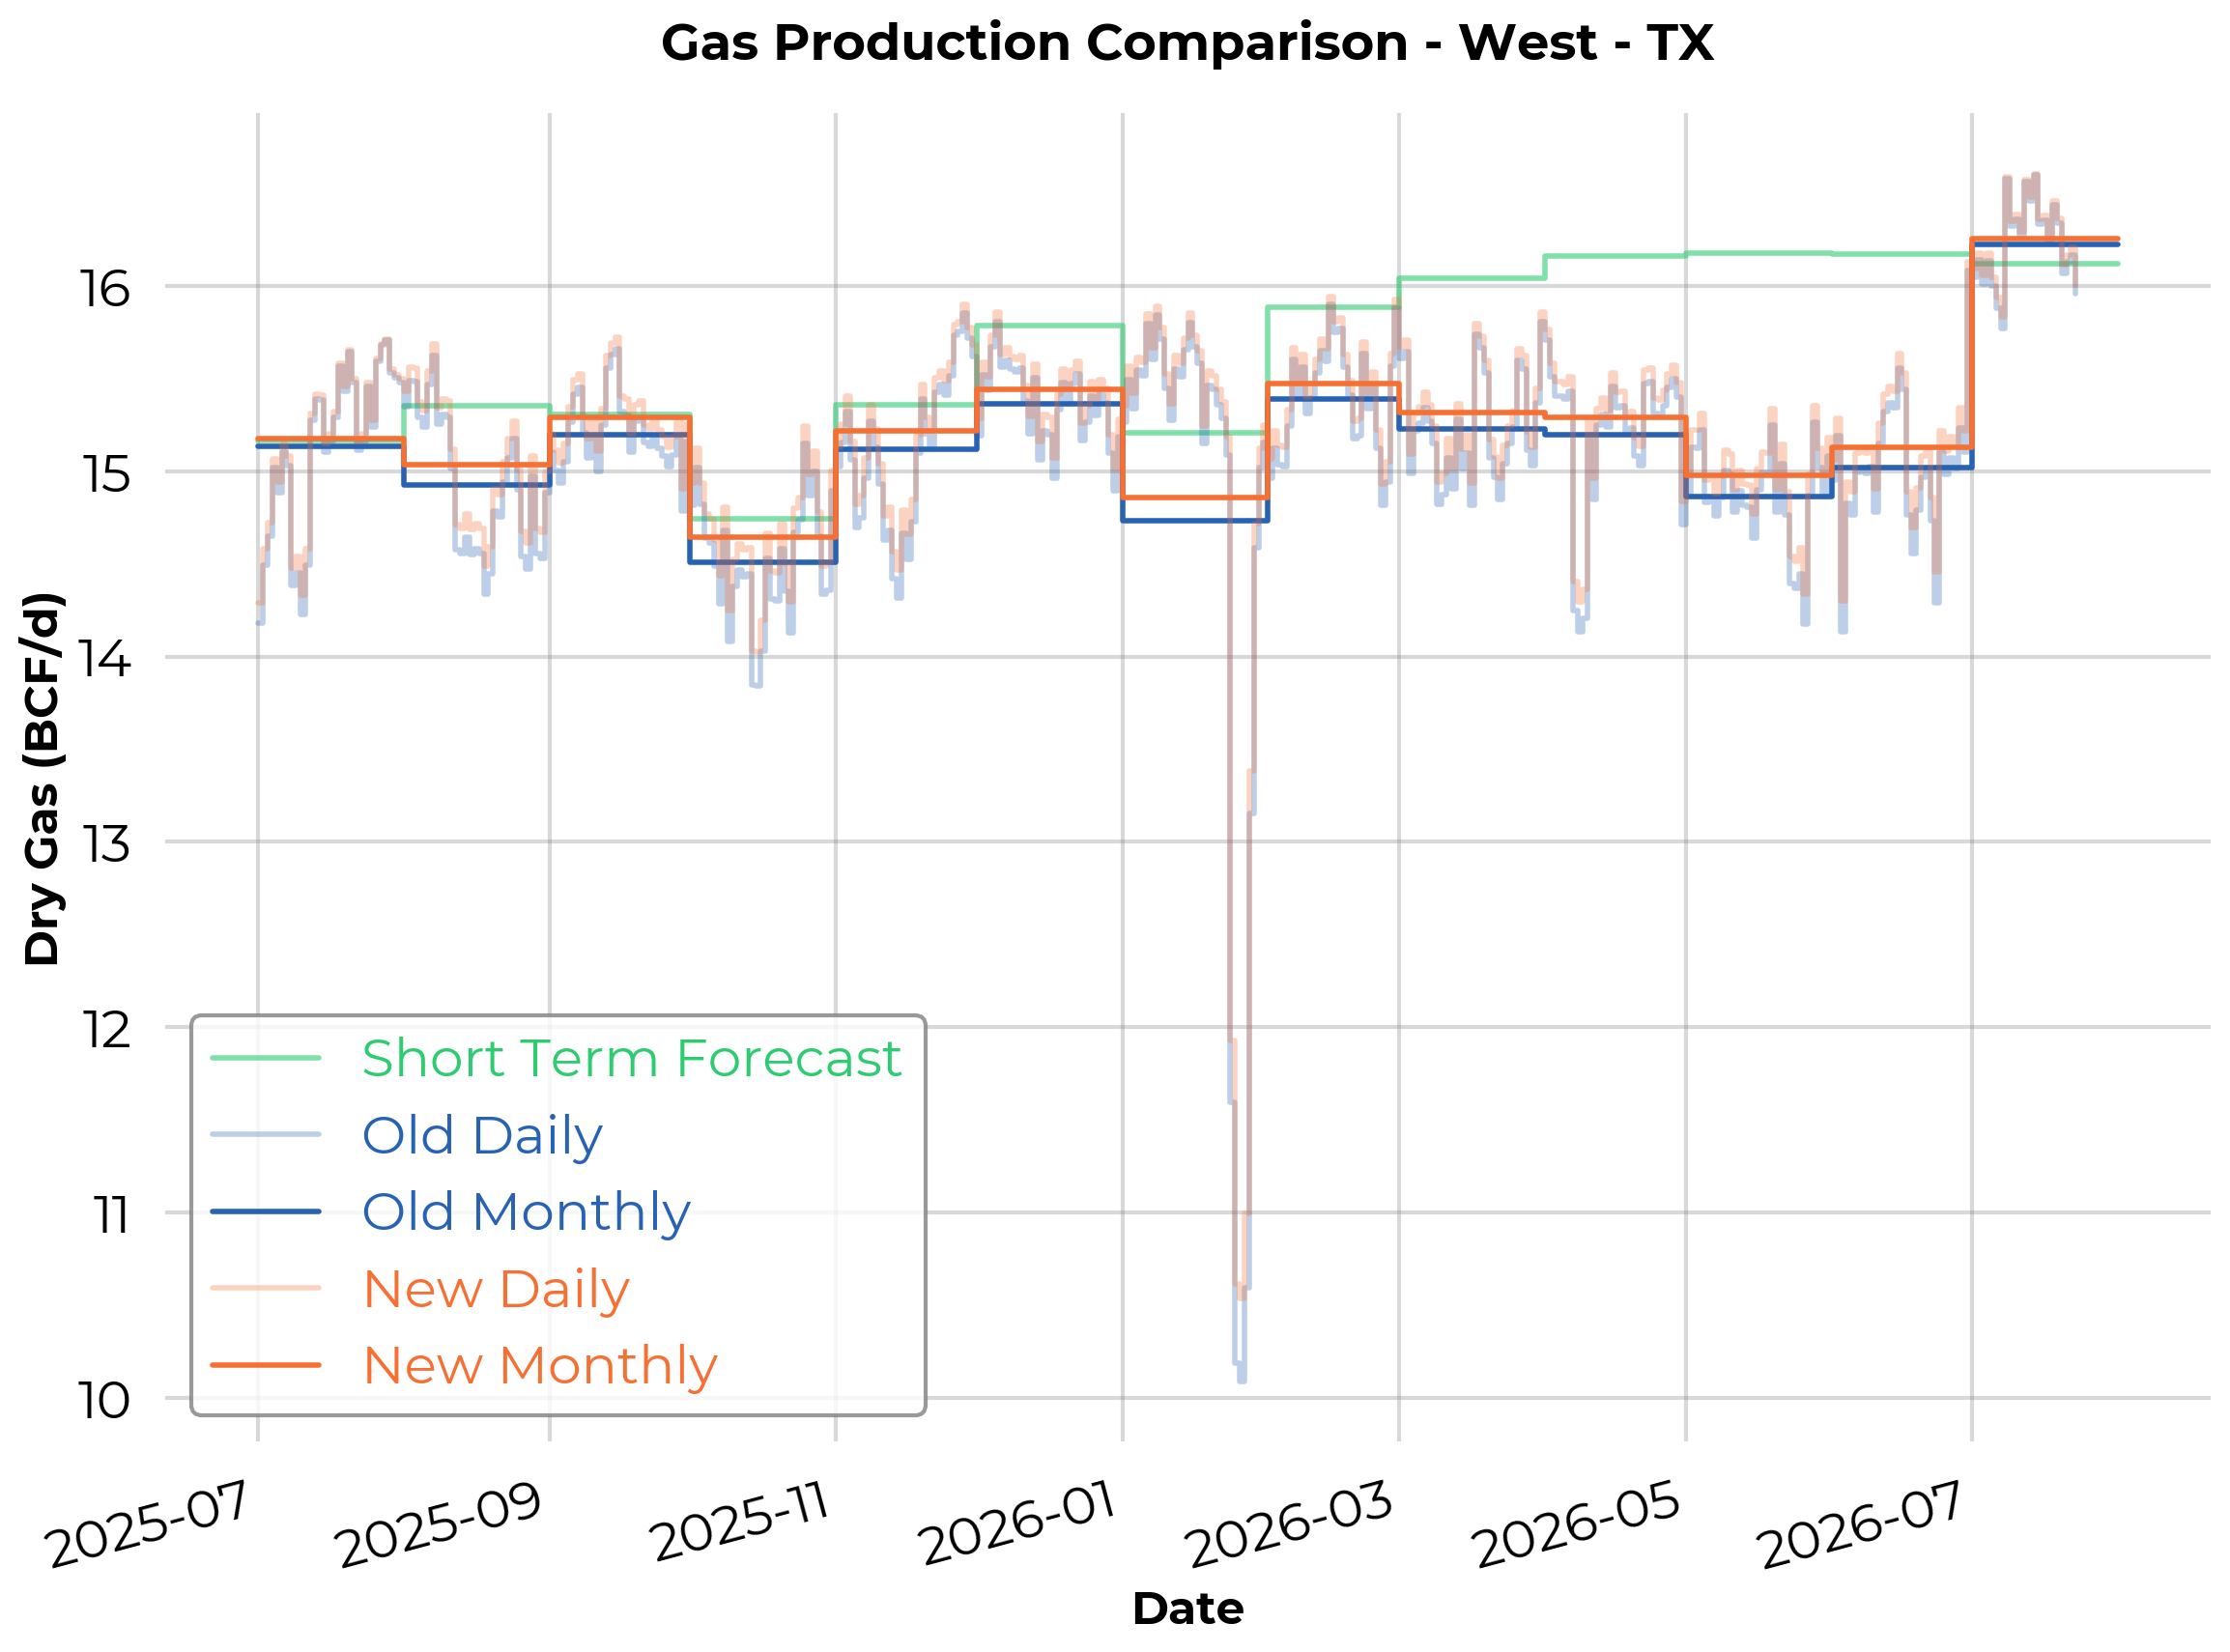
Central Texas
Central Texas has been revised downward by an average of 0.13 Bcf/d, the offsetting side of the same reallocation.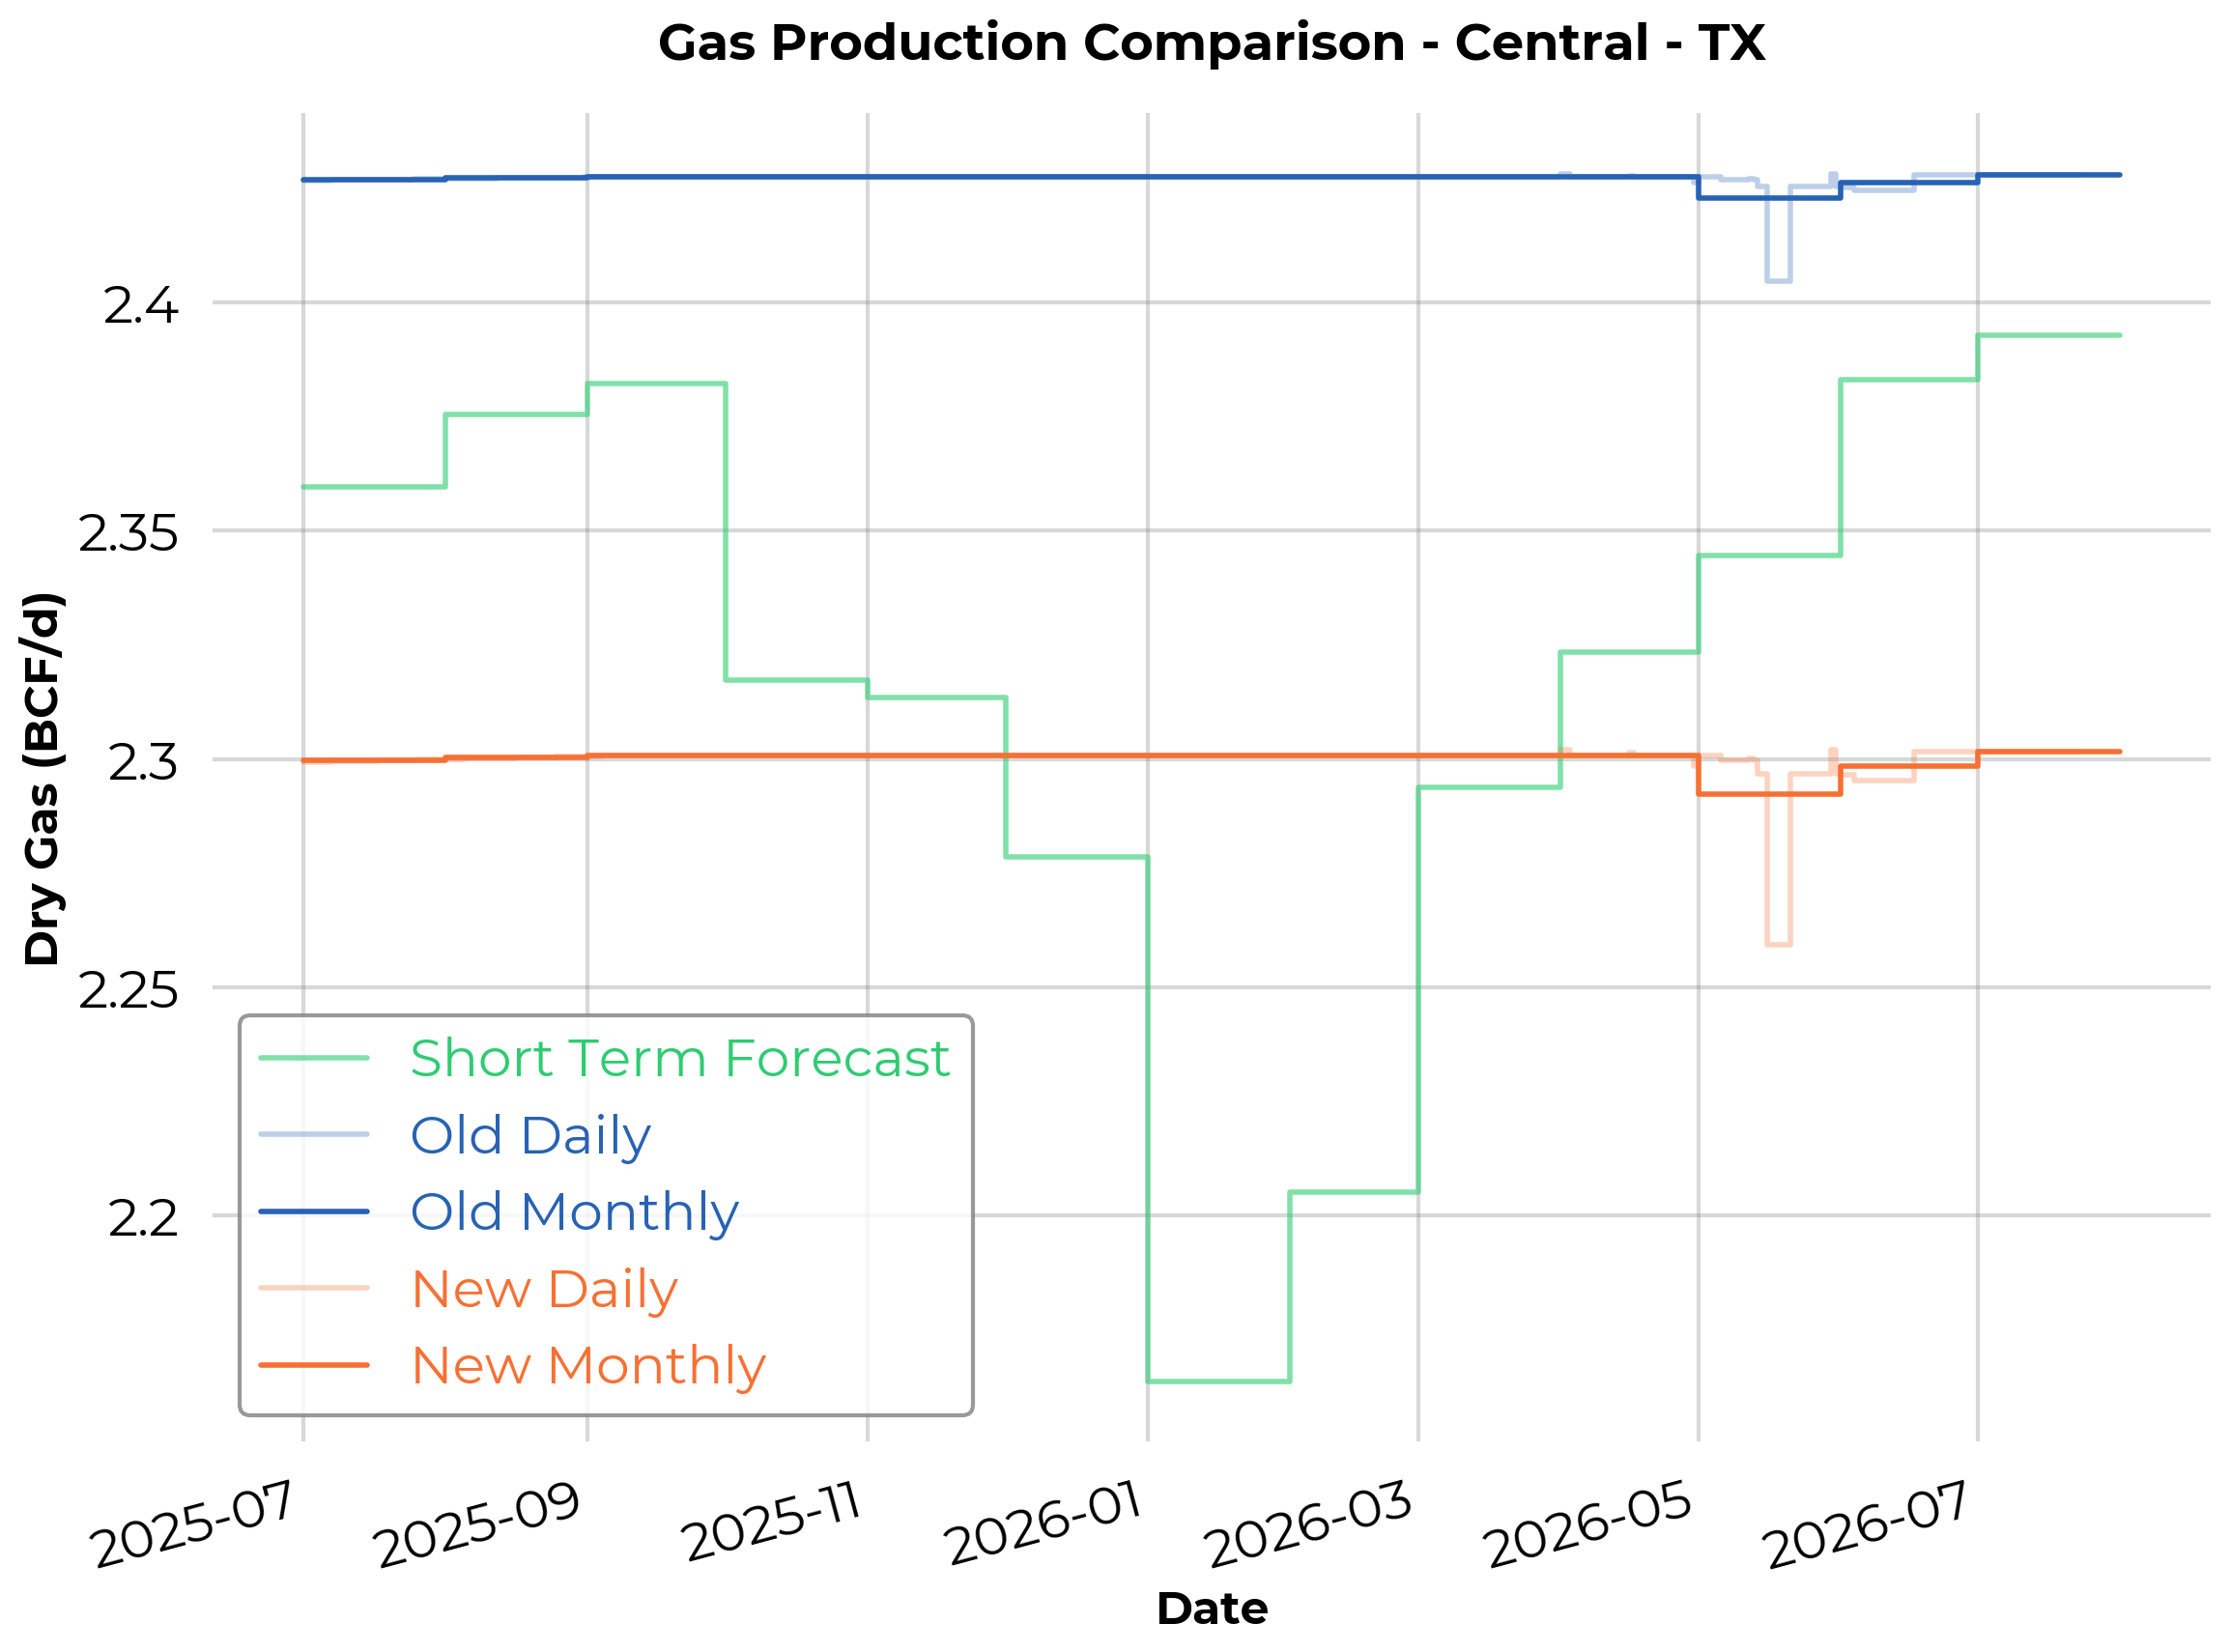
Demand model recalibrations
With the latest release of the EIA's monthly demand data through April 2026, we have updated our demand models accordingly. Of note, modeled demand for the month of April was very much aligned with with the posted EIA numbers, with the total demand realizing within 0.8 Bcf/d of the official EIA monthly data.
| Sector | EIA Actual (Bcf/d) | SynMax Predicted (Bcf/d) | Bias (Bcf/d) |
| Residential | 9.5 | 9.62 | 0.12 |
| Commercial | 7.96 | 8.09 | 0.13 |
| Industrial | 23.19 | 22.81 | -0.39 |
| Electric Power | 29.88 | 30.81 | 0.93 |
| CONUS total | 70.54 | 71.33 | 0.79 |
As a result, our modeled demand numbers from May 1 onwards are effectively unchanged.
As usual, if you have any questions, please reach out to support@synmax.com.
Appendix: Updated Alignment Dates
When fitting our daily production estimates, we consider two key dates for each subregion:
- State alignment cutoff: the date up to which we align our daily production estimates to state-reported production. On this day and prior the daily production model monthly averages are guaranteed to match state data.
- Last fitted date (or "last good" date): the date up to which we regress against the state data. The last fitted date can sometimes extend beyond the state alignment cutoff — this occurs when we are modeling reporting delays and therefore fitting against our own version of the state data (as discussed here).
The current alignment dates by subregion are shown below:
| Sub Region | Last Fitted Date | State Alignment Cutoff |
| Wyoming | 01-Mar-26 | 01-Mar-26 |
| WV | 01-Dec-24 | 01-Dec-24 |
| West - TX | 01-Mar-26 | 01-Aug-25 |
| Utah | 01-Mar-26 | 01-Feb-26 |
| SW PA | 01-Mar-26 | 01-Mar-26 |
| South - TX | 01-Feb-26 | 01-Aug-25 |
| S LA | 01-Feb-26 | 01-Feb-26 |
| SanJuan-CO | 01-Feb-26 | 01-Feb-26 |
| Permian-NM | 01-Mar-26 | 01-Mar-26 |
| OK | 01-Feb-26 | 01-Feb-26 |
| OH | 01-Feb-26 | 01-Nov-24 |
| North - TX | 01-Mar-26 | 01-Mar-26 |
| North Dakota | 01-Apr-26 | 01-Apr-26 |
| N LA | 01-Feb-26 | 01-Oct-25 |
| NewMexico | 01-Mar-26 | 01-Mar-26 |
| NE PA | 01-Mar-26 | 01-Mar-26 |
| MS | 01-Dec-25 | 01-Nov-25 |
| MI | 01-Nov-22 | 01-Nov-22 |
| KS | 01-Feb-26 | 01-Dec-25 |
| Haynesville - TX | 01-Apr-26 | 01-Jan-26 |
| Haynesville - LA | 01-Feb-26 | 01-Dec-25 |
| GOM | 01-Jun-25 | 01-Jun-25 |
| Colorado wo SJ | 01-Feb-26 | 01-Feb-26 |
| Central - TX | 01-Jun-25 | 01-Apr-25 |
| AR | 01-Dec-25 | 01-Dec-25 |
| AL | 01-Oct-22 | 01-Oct-22 |