
Demand model recalibrations
Nowcast
With the latest release of the EIA's monthly demand data through July 2026, we have updated our demand models accordingly. Modeled demand for the month of July was largely aligned with the posted EIA numbers, with the total demand realizing within 0.45 Bcf/d of the official EIA monthly data.
| Sector | EIA Actual (Bcf/d) | SynMax Predicted (Bcf/d) |
Difference (Bcf/d) |
| Residential | 3.55 | 3.56 | 0.01 |
| Commercial | 4.95 | 4.83 | -0.12 |
| Industrial | 21.97 | 22.07 | 0.10 |
| Electric Power | 49.29 | 48.85 | -0.44 |
| L48 total | 79.76 | 79.32 | -0.45 |
This month's recalibration resulted in no material changes to our demand nowcast models output.
Forecast
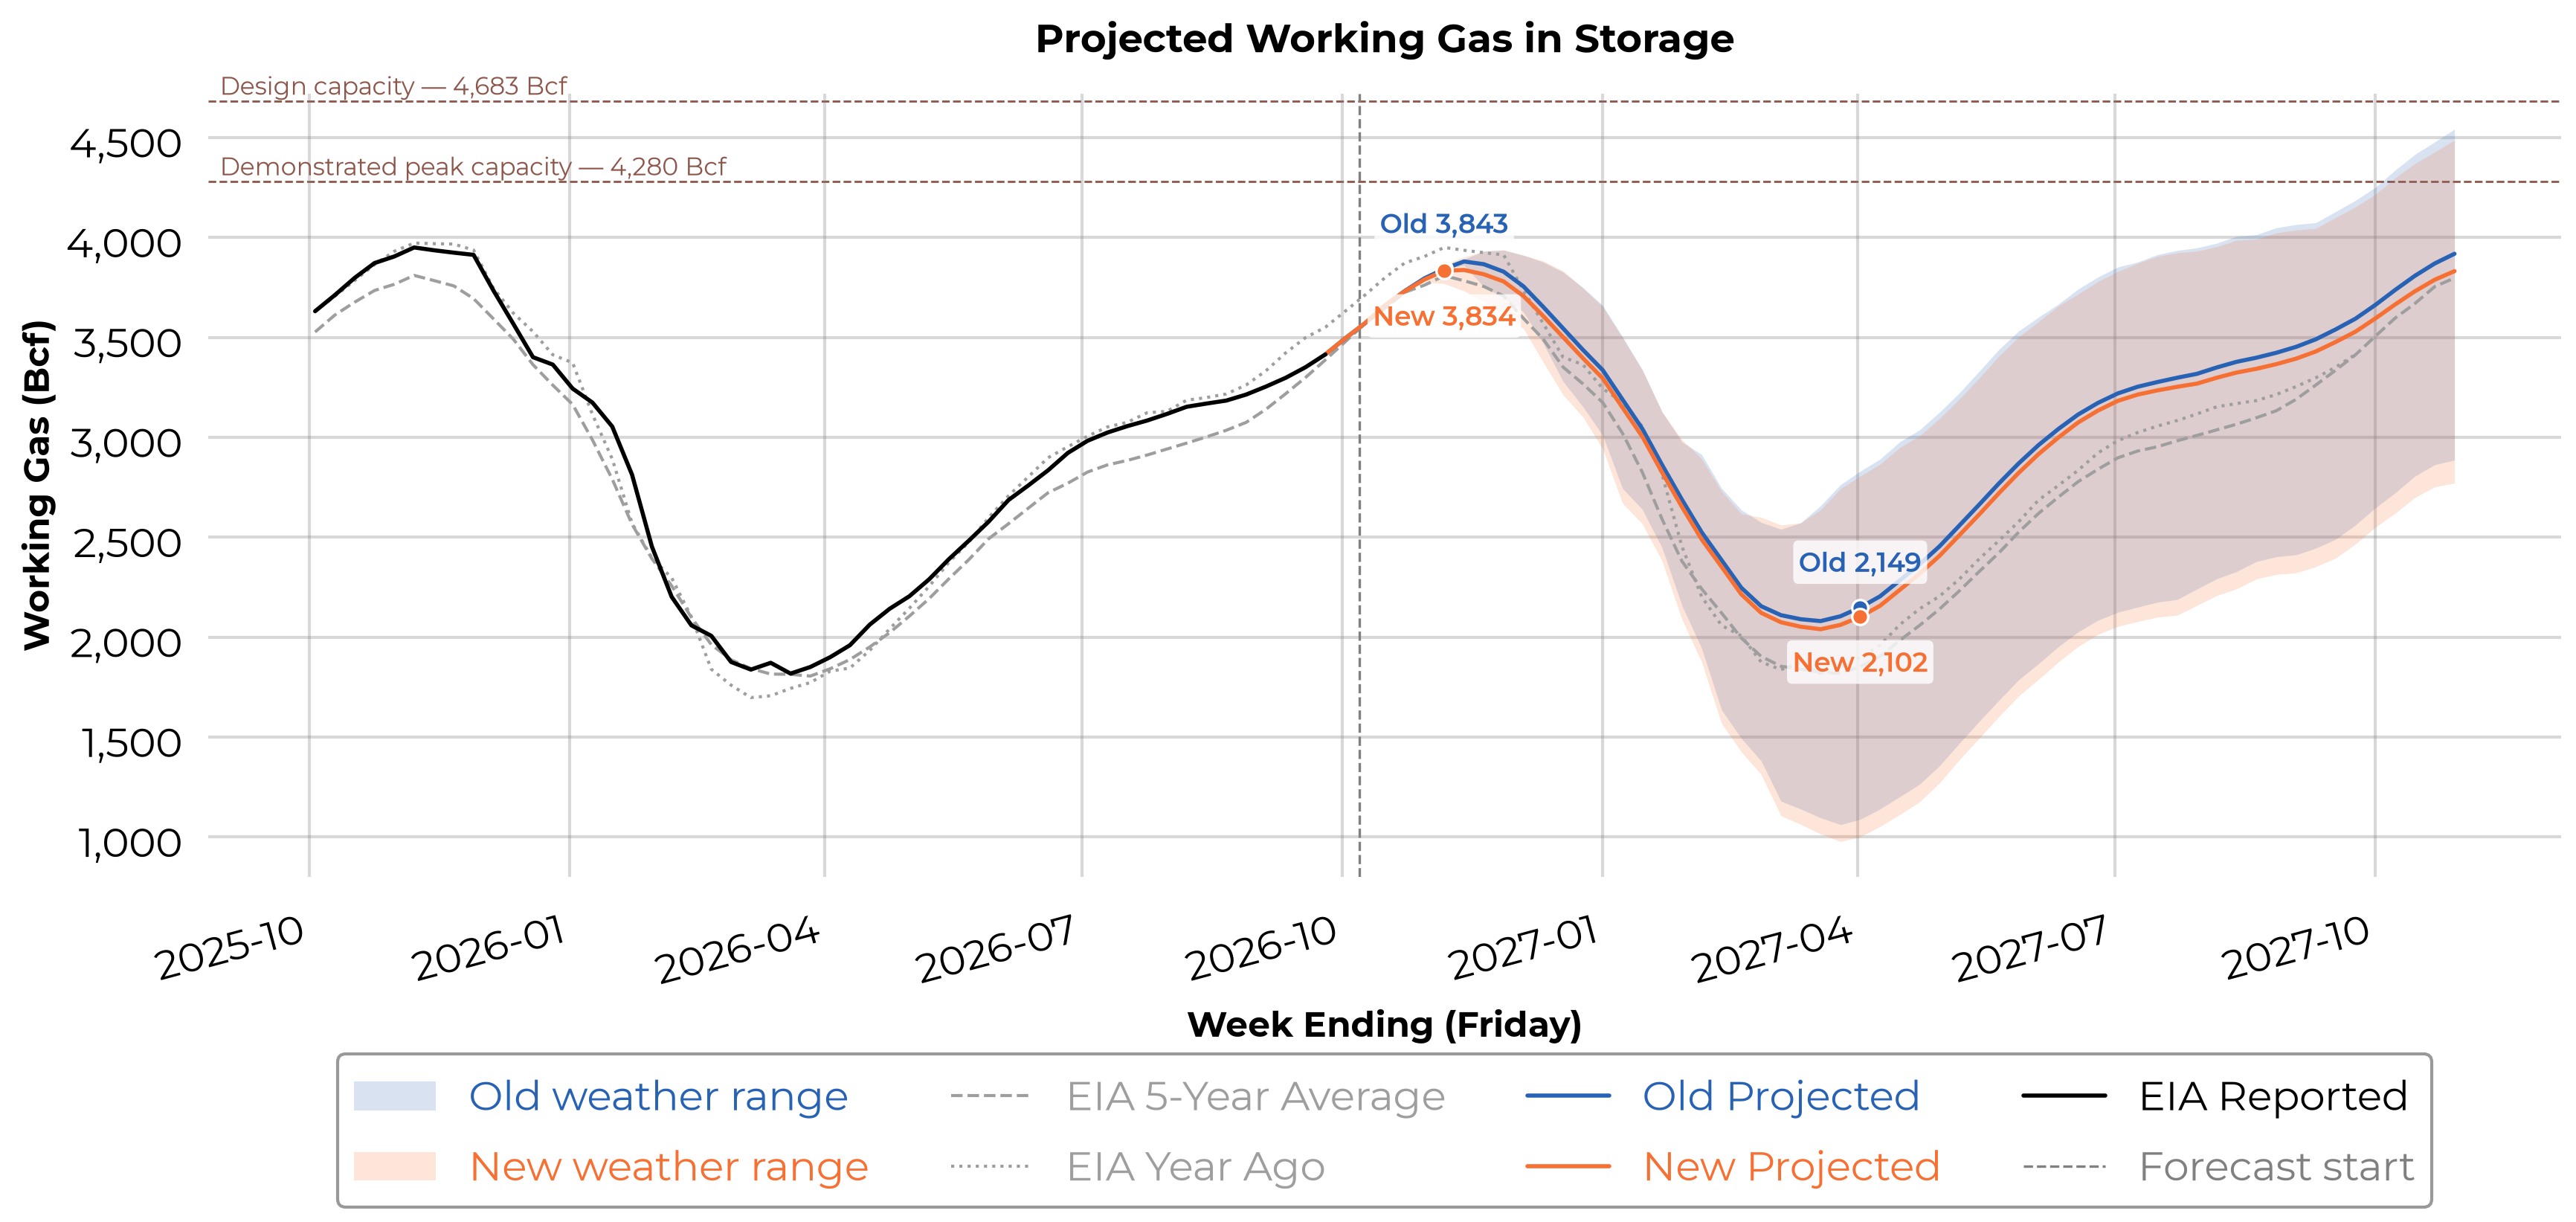
We have also updated our demand forecast using the latest EIA data. The models remain essentially unchanged, refitting them to the updated nowcast reduced projected storage at the end of the next withdrawal season by 47 Bcf. We have moved the in-service dates for Venture Global CP2, Rio Grande, and Port Arthur forward to reflect the latest FERC filings from these facilities. These changes reduced projected storage at the end of the 2027 injection season by 52 Bcf.
Daily Production Update
This month's production update is a modest one. We refreshed our regressions against the latest state-reported data, and our existing model continues to track well across almost every subregion. The changes will go live the morning of 7 October 2026.
L48 Changes
The update has essentially no effect on our modelled L48 production level.
-png.png?width=2306&height=1708&name=gas_comparison_l48%20(8)-png.png)
Appendix: Updated Alignment Dates
When fitting our daily production estimates, we consider two key dates for each subregion:
- State alignment cutoff: the date up to which we align our daily production estimates to state-reported production. On this day and prior the daily production model monthly averages are guaranteed to match state data.
- Last fitted date (or "last good" date): the date up to which we regress against the state data. The last fitted date can sometimes extend beyond the state alignment cutoff — this occurs when we are modeling reporting delays and therefore fitting against our own version of the state data (as discussed here).
The current alignment dates by subregion are shown below:
| Sub Region | Last Fitted Date | State Alignment Cutoff |
| Wyoming | 01-Jun-26 | 01-Jun-26 |
| WV | 01-Dec-25 | 01-Nov-25 |
| West - TX | 01-May-26 | 01-Sep-25 |
| SW PA | 01-Jun-26 | 01-Jun-26 |
| South - TX | 01-Apr-26 | 01-Aug-25 |
| SanJuan-CO | 01-Mar-26 | 01-Feb-26 |
| S LA | 01-May-26 | 01-Feb-26 |
| Permian-NM | 01-Jun-26 | 01-May-26 |
| OK | 01-Jun-26 | 01-Jun-26 |
| OH | 01-Jun-26 | 01-Nov-24 |
| North Dakota | 01-Jul-26 | 01-Jul-26 |
| North - TX | 01-May-26 | 01-May-26 |
| NewMexico | 01-May-26 | 01-May-26 |
| NE PA | 01-Jun-26 | 01-Jun-26 |
| N LA | 01-May-26 | 01-May-26 |
| MS | 01-Dec-25 | 01-Nov-25 |
| MI | 01-Nov-22 | 01-Nov-22 |
| KS | 01-Mar-26 | 01-Dec-25 |
| Haynesville - TX | 01-Apr-26 | 01-Jan-26 |
| Haynesville - LA | 01-May-26 | 01-Dec-25 |
| GOM | 01-Jun-25 | 01-Jun-25 |
| Colorado wo SJ | 01-Apr-26 | 01-May-26 |
| Central - TX | 01-Dec-25 | 01-Dec-25 |
| AR | 01-Dec-25 | 01-Dec-25 |
| AL | 01-Oct-22 | 01-Oct-22 |