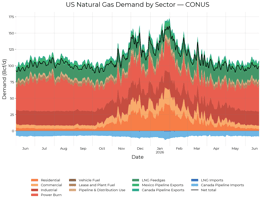
Our US Gas Demand release brought you daily demand estimates for today and the past. As promised, we are now making the forward forecasts available as well—alongside production, trade and LNG in a full supply and demand balance.
You can now follow the natural gas market from yesterday through the coming seasons, explore what different weather years would mean for demand, and evaluate the resulting implications for storage. This release adds both a forward outlook and the components needed to put that outlook in context.
What's New
The Hyperion Production Datalink now includes Full Supply & Demand Balances (hdl.gas_balance), covering daily history, current estimates and future projections.
- Forward forecasts: Daily supply and demand projections extending approximately two years, consolidated in a single datalink table.
- Historical-weather scenarios: All weather-related demand components include scenarios showing the effect of “replaying” any historical weather year in the available library through the demand models.
- A demand-based baseline: Beyond the near-term weather forecast, our baseline averages the modeled demand outcomes from the most recent ten historical-weather years—not the weather inputs.
- The complete national picture: Production, domestic consumption, Canadian and Mexican pipeline trade, LNG imports and LNG feedgas, together with a balancing factor.
- National and regional detail: CONUS totals, plus production and sectoral consumption across the five EIA storage regions: East, Midwest, Mountain, Pacific and South Central. Trade, LNG and the balancing factor are national only.
- Continuity with history: Daily baseline coverage begins January 1, 2024. Estimates refresh intraday as underlying data is updated.
Modeling Approach: From Today's Demand to the Forward Outlook
The demand forecasts build on the sector-specific historic models introduced in our original release. Those models combine pipeline and weather signals with the drivers relevant to each sector, with historical estimates anchored to EIA monthly data.
Residential and commercial demand respond primarily to heating conditions. Industrial demand combines weather sensitivity with underlying economic activity. Electric power demand incorporates heating and cooling responses, including the nonlinear increase in gas burn during periods of high cooling demand, as well as estimates of load growth.
The new release takes that analysis forward. Near-term demand uses the weather forecast. Beyond the GFS forecast horizon, historical-weather scenarios let you explore how the outlook changes under different weather patterns rather than relying on a single assumed weather path.
Replay the Weather, Not the Historical Demand
All weather-related demand pieces include historical-weather scenarios. Each scenario replays a selected year's weather through the demand models to show what that weather would mean for the forward demand outlook. The current library covers 2001 through 2025.
These are not copies of demand observed in those historical years. The weather is replayed within the forward modeling framework. This lets you ask: What would demand look like if the weather from a particular year occurred again?
You can examine individual years, compare colder and milder outcomes, and trace the differences through regional demand, the national balance and implied storage changes. These are conditional outcomes.
The Baseline Averages Demand Outcomes, Not Weather
Our demand baseline is constructed by running the models separately with each of the most recent ten historical-weather years, then averaging the resulting demand forecasts, not by averaging 10 years of weather to model demand from.
The distinction matters because demand does not respond linearly to temperature. Averaging weather first can smooth away cold spells and heat waves before their effect on consumption is calculated. Modeling each year separately captures those responses before the demand outcomes are averaged.
The published baseline therefore provides the central demand outlook, while the individual weather-year scenarios show how that outlook could differ under specific historical weather patterns.
From Forecast Demand to the Full Balance
The forward demand outlook is available alongside production and the other supply and demand components in one daily view. This makes it possible to evaluate not just how much gas might be consumed, but what the combination of supply and demand implies for storage over the coming weeks and seasons.
In the balance dataset, supply is positive and consumption and exports are negative. The balancing factor may be either sign. Summing all components for CONUS and a single scenario gives the implied daily storage change: positive for an injection, negative for a withdrawal.
These remain modeled estimates and projections, not reported storage observations. Forecasts and recent estimates can change as new inputs become available.
Data Access
Overview demand information is already available on the SynMax front end, under Quickview.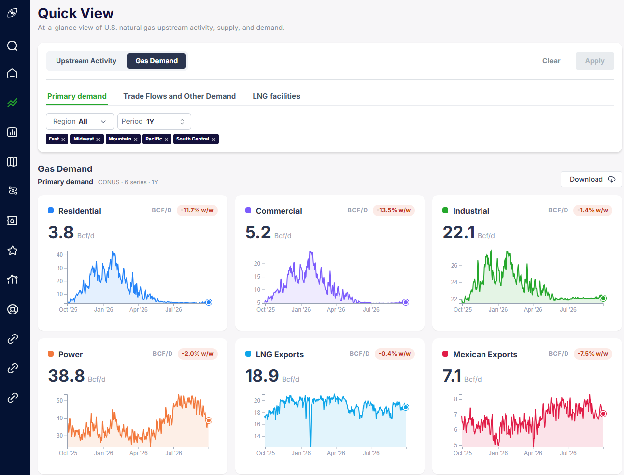
We are also building an extensive collection of pre-made demand and balance dashboards to make the forecasts, weather scenarios and common analytical workflows easier to explore without writing queries. Note that though these use Agents on the backend, they don’t consume your credit balances, nor do they require you to be authorized for Agents.
Explore the Gas Balances Quick Reference and pre-made dashboards
For custom analysis, use SynMax Agents. The data also remains accessible through the Hyperion v4 API's query_datalinks function for integration into your own workflows.
For more details, see the accompanying details here.
With this release, you can move beyond tracking where demand has been to evaluating where it could go—and what that means for the full gas balance. Start with the forward baseline, explore the effect of replaying different weather years, and use the dashboards or your own workflows to assess the implications for the coming weeks and seasons.