
*|MC:SUBJECT|*
*|MC_PREVIEW_TEXT|*

Vulcan Coal Stocks to US Stocks Review
As noted previously Vulcan’s methodology is to use a sample of the coal piles in the US to calculate the entire coal stock. On the selected stockpiles, we use advanced satellite imagery to create 3D surface models which can then be used to determine the volumes of the piles. The connection between the coal plants selected and the total US fleet produced an initial correlation of (R^2 ~ 0.9). This article will look more closely at the correlation and see if the back cast reveals any potential issues.
Below we display a backcast of total US coal stocks using the sample of plants we selected (as described in previous articles) from 2018 to 2021. 2021 is our starting point for the backcast since the EIA only releases plant stock data on a 2-year lag so our last datapoint from them is December 2021. 2018 is our end boundary to account for the significant changes in capacity due to coal plant retirements. 2018 is the last year where capacity is within 15% of current capacity levels while the difference between 2021 and 2023 is 10%.
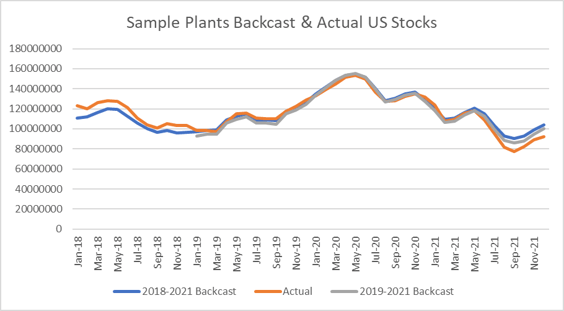
As the chart shows, the 2018-2021 has some divergence at the two ends – the back cast is too low in 2018 and too high in 2021 compared to the actual piles. To investigate why we looked at prices at the time however, the dark spread (coal plant margin) using Ohio coal price and PJMW wholesale benchmark is relatively similar in those periods. The difference seems to be from the production of coal. Total US coal production dropped 25% in 2018 to 2021 whereas the coal fleet only changed 15%. This leads us to noting a reduced coal production could lead to slightly lower stocks than projected.
As mentioned, we also did this exercise without 2018 using only 2019-2021 data which had a greater R^2 value (>.95) however we determined this shorter period does not capture the complexity of the market in terms of price diversity and market conditions. The divergence is consistent in both exercises just to a varying degree.
When looking at the wider context there is a reason our selected sample of plants can be representative of the larger population. We specifically selected plants that had the most variability in utilization as affected by price fluctuations. This means that the plants we selected are able to represent a larger portion of the total US coal fleet variability.
As always we look forward to your comments and suggestions as we expand the power of Vulcan.
Want to change how you receive these emails?
You can update your preferences or unsubscribe from this list.