*|MC:SUBJECT|*
*|MC_PREVIEW_TEXT|*

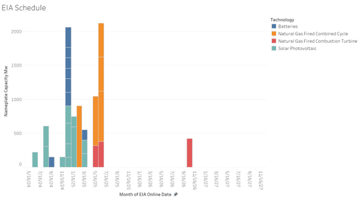
EIA Update & Vulcan's Precision Forecasting
Early Access to Organized EIA-923 Data via UI and Enhanced Visualization with Tableau

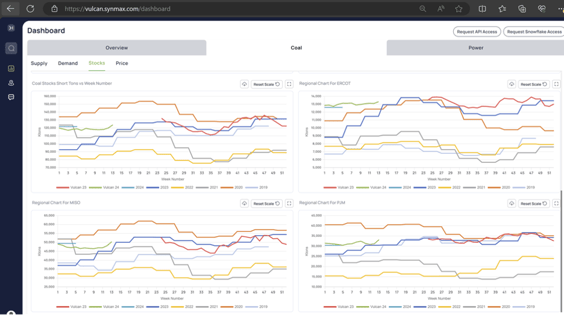
Despite these limitations, Vulcan excels at capturing the overall trend over time. The December inventory data initially appeared unusually high, considering favorable December dark spreads. This discrepancy could be attributed to holiday reporting irregularities, as usual personnel responsible for reporting might have been on vacation. Thankfully, satellite imaging and calculations employed by Vulcan mitigate such human factors.
Our regional models further demonstrates convergence within PJM during week four, while ERCOT remains slightly higher and MISO slightly lower, as reflected in the attached dashboard screenshot.
Vulcan: Continuous Feature Development
We are committed to continuously improving Vulcan's capabilities. Currently, we are developing a predictive model to forecast next week's natural gas ratio. This model will incorporate the latest associated load forecast to calculate fossil fuel generation.
Subsequently, it will utilize the ICE futures market view to estimate the implied dark spread for the week. Finally, by combining this information with Vulcan's sentiment data (counts and inventory levels), we aim to predict the expected natural gas ratio for the following week.
*|LIST:DESCRIPTION|*