Headline: modeled injection tightens sharply to +55 Bcf SynMax's modeled storage build for the week...
Weekly Storage and S/D Brief - Week Ending 11/6/2026
Week Ending November 6, 2026
SynMax Analytics | Published November 12, 2026
Headline
SynMax models a +65 Bcf injection for the week ending November 6, down 12 Bcf from the prior week's EIA-reported +77 Bcf build. If confirmed, working gas storage would stand at about 3,866 Bcf. That is roughly 84 Bcf below last year's level (3,950 Bcf) and about 86 Bcf (+2.3%) above the five-year average. The modeled build is well above last year's +45 Bcf for the same week and the five-year average of about +34 Bcf, so the year-on-year deficit would narrow further from 109 Bcf. EIA will release this week's storage report on Friday, November 13 instead of the usual Thursday.
Review the full analysis on the dashboard.
Storage Summary
Last week, falling heating demand and a Freeport outage loosened the balance. This week supply did most of the work in the other direction. Dry gas production fell 2.13 Bcf/d WoW to 109.45 Bcf/d, its lowest weekly average in at least five weeks, with the Gulf/TX/LA (-1.40) and Northeast (-0.82) both lower. Higher Canadian imports (+0.85 Bcf/d to 8.03 Bcf/d) offset part of the drop, leaving total gross supply down 1.26 Bcf/d at 117.50 Bcf/d. Demand firmed at the same time. Total demand rose 1.24 Bcf/d to 107.74 Bcf/d, led by Res/Com (+0.78) as cold returned to the Midwest and West late in the week, and power burn (+0.41). A smaller Balancing Factor (0.52 vs 1.15 Bcf/d) narrowed the gap slightly. The implied daily surplus fell 1.88 Bcf/d to 9.24 Bcf/d.
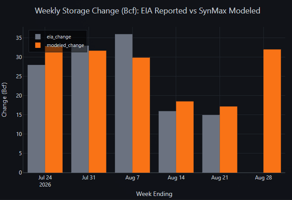
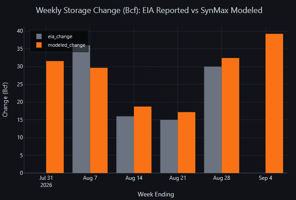
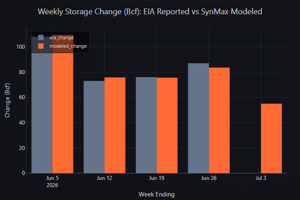
Model accuracy: Across the full scoring window since July 3 (eighteen weeks, CONUS), the SynMax storage-number model has averaged a mean absolute error (MAE) of 4.1 Bcf, with a near-zero bias of -0.4 Bcf. Over the last five weeks the MAE was 3.9 Bcf, with a +0.9 Bcf bias.
| Week Ending | EIA (Bcf) | SynMax Model (Bcf) | Error |
|---|---|---|---|
| Oct 02 | +85 | +81.4 | -3.6 |
| Oct 09 | +67 | +71.7 | +4.7 |
| Oct 16 | +77 | +83.4 | +6.4 |
| Oct 23 | +80 | +76.0 | -4.0 |
| Oct 30 | +77 | +77.8 | +0.8 |
The accuracy table reflects SynMax's latest supply/demand models. Modeled weekly values are recalculated as source data updates, so the resulting weekly storage may differ modestly from the official weekly storage-number call scored directly against EIA releases.
Primary Driver: Production Pullback Tightens the Balance
Dry gas production fell 2.13 Bcf/d WoW to 109.45 Bcf/d, though it was still 2.04 Bcf/d above last year's 107.41 Bcf/d. Output peaked at 113.04 Bcf/d on October 31, then dropped to about 109 Bcf/d on November 1-2 and to a weekly low of 107.70 Bcf/d on November 3. It recovered to 110.09 Bcf/d by November 6. The Gulf/TX/LA drove most of the decline, falling 1.40 Bcf/d to 42.69 Bcf/d. The Northeast gave back 0.82 Bcf/d to 34.95 Bcf/d after two weeks of gains. The West (+0.08) and Midwest (+0.01) were steady. Canadian pipeline imports rose 0.85 Bcf/d to 8.03 Bcf/d, their highest weekly level in at least five weeks, offsetting about 40% of the production loss.
Demand added to the tightening. Res/Com demand rose 0.78 Bcf/d to 14.70 Bcf/d. Daily Res/Com dropped to about 12.6 Bcf/d during the mild November 3-4 stretch, then jumped to 17.82 Bcf/d on November 6 as the first winter-type cold arrived. Even so, Res/Com remains 6.24 Bcf/d below last year's 20.94 Bcf/d, when the same week was much colder. CONUS power burn rose a further 0.41 Bcf/d to 32.95 Bcf/d, now 3.96 Bcf/d above year-ago levels. Industrial demand edged up 0.11 Bcf/d to 22.96 Bcf/d.
Net, the daily surplus narrowed 1.88 Bcf/d to 9.24 Bcf/d, cutting the modeled injection to +64.7 Bcf from the +77.8 Bcf model value for the prior week (+77 Bcf EIA-reported).
Weather Context
National population-weighted HDDs averaged 6.9 for the week ending November 6, essentially unchanged from the prior week's 6.8 and well below the year-ago 10.8:
- The weekly average hides a sharp swing within the week. CONUS HDDs fell from 8.2 on October 31-November 1 to a low of 5.2 on November 3, then rose back to 8.2 by November 6 and 11.4 on November 7. The national average temperature was little changed at 59.7°F, about 5°F warmer than the same week last year.
- The East warmed further. HDDs fell to 5.7 (from 7.9) and the average temperature rose to 61.4°F, which pulled eastern Res/Com down 0.41 Bcf/d. Cooling degree days in the East rose to 2.1 (from 1.5), which supported eastern power burn.
- The Midwest and West turned colder. HDDs rose to 8.6 in the Midwest (from 6.7), 13.7 in Mountain (from 11.2) and 9.2 in Pacific (from 7.8). Res/Com rose in all three regions (Midwest +0.60, Mountain +0.26, Pacific +0.23), more than offsetting the eastern decline.
- South Central stayed warm (CDD 4.4 vs 4.2), keeping its power burn firm.
Supply & Demand Factor Changes (WoW)
| Factor | WE 10/30 (Bcf/d) | WE 11/6 (Bcf/d) | Δ WoW | Impact |
|---|---|---|---|---|
| SUPPLY | ||||
| Dry Gas Production | 111.58 | 109.45 | -2.13 | Bullish |
| Canada Pipeline Imports | 7.18 | 8.03 | +0.85 | Bearish |
| LNG Imports | 0.00 | 0.03 | +0.03 | Bearish |
| Total Gross Supply | 118.76 | 117.50 | -1.26 | Bullish |
| DEMAND | ||||
| Electric Power | 32.54 | 32.95 | +0.41 | Bullish |
| Industrial | 22.85 | 22.96 | +0.11 | Bullish |
| Res/Com | 13.92 | 14.70 | +0.78 | Bullish |
| LNG Feedgas (exports) | 20.19 | 20.21 | +0.02 | Bullish |
| Mexico Pipeline Exports | 6.25 | 6.23 | -0.02 | Bearish |
| Canada Pipeline Exports | 2.69 | 2.67 | -0.02 | Bearish |
| Lease/Plant/Pipe/Vehicle | 8.07 | 8.03 | -0.04 | Bearish |
| Total Demand | 106.50 | 107.74 | +1.24 | Bullish |
| Balancing Factor | +1.15 | +0.52 | -0.63 | — |
| Implied Daily Surplus | 11.12 | 9.24 | -1.88 | |
| Weekly Injection (Bcf) | +77.8 | +64.7 | -13.1 |
Note: Canadian pipeline imports are treated as a supply source; Canadian pipeline exports are treated as demand (gas leaving the domestic market). The Balancing Factor captures the residual between independently modeled supply and demand components and is reported below the totals. It is folded into the implied change but excluded from Total Supply and Total Demand. Prior-week values reflect the latest model run and may differ slightly from last week's brief.
Secondary Factors
LNG Feedgas: Flat Week as Freeport Recovers
Total LNG feedgas was essentially flat at 20.21 Bcf/d (+0.02), still 1.82 Bcf/d above the year-ago level of 18.39 Bcf/d. Freeport set the pattern within the week. Flows fell again to 0.71 Bcf/d on November 1 and stayed weak through November 3, then recovered steadily to 2.17 Bcf/d by November 6. Freeport has held near 2.48 Bcf/d since November 7. For the week it averaged 1.43 Bcf/d (+0.08). Corpus Christi eased 0.13 Bcf/d to 3.58 Bcf/d after dipping to 3.26 Bcf/d on November 3. Golden Pass added 0.06 Bcf/d to 0.80 Bcf/d, and Calcasieu Pass and Cove Point each added 0.05 Bcf/d. Sabine Pass (4.88) and Plaquemines (4.32) were steady.
Industrial, Mexico Exports & Canadian Flows
Industrial demand rose 0.11 Bcf/d to 22.96 Bcf/d, still 1.00 Bcf/d below last year's 23.96 Bcf/d. Pipeline exports to Mexico held at 6.23 Bcf/d (-0.02) after several weeks of seasonal decline. Canadian flows were the bigger story. Imports rose 0.85 Bcf/d to 8.03 Bcf/d while exports to Canada slipped 0.02 Bcf/d to 2.67 Bcf/d. Net Canadian imports rose to about 5.4 Bcf/d, the largest bearish contribution on the week.
Regional Power Burn
| Region | WE 10/30 (Bcf/d) | WE 11/6 (Bcf/d) | Δ WoW | LY (Bcf/d) | YoY Δ |
|---|---|---|---|---|---|
| East | 13.38 | 14.10 | +0.72 | 12.56 | +1.54 |
| Midwest | 4.14 | 4.02 | -0.12 | 3.38 | +0.64 |
| South Central | 9.72 | 9.85 | +0.13 | 8.58 | +1.27 |
| Mountain | 2.75 | 2.61 | -0.14 | 2.50 | +0.11 |
| Pacific | 2.55 | 2.36 | -0.19 | 1.96 | +0.40 |
| CONUS | 32.54 | 32.95 | +0.41 | 28.99 | +3.96 |
The East drove the national gain, adding 0.72 Bcf/d to 14.10 Bcf/d as warmer weather lifted the cooling load. South Central added 0.13 Bcf/d. The Midwest (-0.12), Mountain (-0.14) and Pacific (-0.19) eased as colder weather cut cooling load there. All five regions are above year-ago levels, and CONUS power burn now runs 3.96 Bcf/d above last year. The East (+1.54) and South Central (+1.27) account for about 70% of that gap. CONUS power burn peaked at 34.64 Bcf/d on November 6.
Outlook: Week Ending November 13
Early data for the week ending November 13 (six of seven days, through November 12) point to a build of about +25 Bcf.
- Res/Com surges: Res/Com demand is averaging about 19.2 Bcf/d week-to-date (+4.5 Bcf/d), peaking at 21.0 Bcf/d on November 7. CONUS HDDs averaged about 10 over November 7-11, up from 6.9 last week.
- Supply steady, Canada higher: Dry gas production is averaging about 109.4 Bcf/d week-to-date, flat WoW. Canadian pipeline imports are higher again at about 8.7 Bcf/d (+0.7 Bcf/d).
- LNG feedgas back above 21 Bcf/d: With Freeport holding near 2.5 Bcf/d, total feedgas is averaging about 21.3 Bcf/d week-to-date (+1.0 Bcf/d). Sabine Pass eased to about 4.1-4.5 Bcf/d on November 10-12.
- Industrial and power: Industrial demand is up about 0.8 Bcf/d to 23.8 Bcf/d. Power burn is roughly flat at about 32.7 Bcf/d.
- Weather ahead: The latest forecast lifts CONUS HDDs to about 17 on November 13 and near 20 on November 14, holds them around 15-18 through November 18, and moderates to about 12-13 the following week. The November 13 cold, combined with a same-day November 12 reading that is still filling in, could push the final figure for the week lower. The season's first net withdrawal looks likely in the week ending November 20.
Early read: ~+25 Bcf. That compares with a 14 Bcf withdrawal in the same week last year and a five-year average build of about +27 Bcf. The year-on-year storage deficit would narrow further, to roughly 45 Bcf.
Methodology & Data Sources
Storage change is modeled as Total Supply (Dry Gas Production + Canadian Pipeline Imports + LNG Imports) minus Total Demand (all consumption sectors + LNG feedgas exports + pipeline exports), net of the Balancing Factor calibration residual, multiplied by seven days. The EIA storage week runs Saturday through Friday; the week ending November 6 covers Saturday, October 31 through Friday, November 6. Canadian pipeline imports are treated as a supply source supplementing domestic production, and Canadian pipeline exports are treated as demand. The Balancing Factor (+0.52 Bcf/d this week) is the residual between independently modeled supply and demand components and calibrates the injection estimate against EIA actuals.
Data sources: SynMax daily production model (hdl.daily_production), SynMax demand model (hdl.gas_demand, baseline scenarios), SynMax LNG feedgas model (hdl.lng_feed_gas), EIA Weekly Natural Gas Storage Report (hdl.eia_storage_final), NOAA GFS/HRRR weather data.
Disclaimer: This report is produced by SynMax Analytics for informational purposes only. Modeled figures are estimates and may differ from official EIA releases. Past model accuracy does not guarantee future performance.