Headline SynMax models a +32 Bcf injection for the week ending August 7, roughly in line with the...
Weekly Storage and S/D Brief - Week Ending 9/4/2026
Week Ending September 4, 2026
SynMax Analytics | Published September 9, 2026
Headline
SynMax models a +39 Bcf injection for the week ending September 4, up 9 Bcf from the prior week's EIA-reported +30 Bcf build and the largest weekly injection since early August. Unlike the prior week's cooldown-driven story, this acceleration is supply-led: total gross supply firmed +1.57 Bcf/d WoW to 121.06 Bcf/d as Canadian pipeline imports rebounded +0.88 Bcf/d and dry gas production climbed +0.69 Bcf/d to 112.41 Bcf/d, outrunning a modest +0.72 Bcf/d uptick in total demand. Power burn actually eased slightly (-0.56 Bcf/d to 47.73 Bcf/d) even as national cooling degree days firmed, as late-summer heat rotated into the populous East and Midwest while the South Central rolled over. The daily surplus widened to 5.61 Bcf/d. If confirmed, working gas storage would stand at approximately 3,254 Bcf, about 79 Bcf below last year's pace but a comfortable +157 Bcf (+5.1%) above the five-year average.
Review the full analysis on the dashboard.
Storage Summary
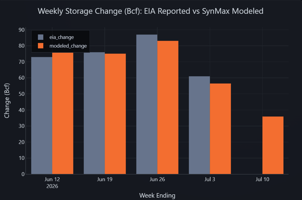
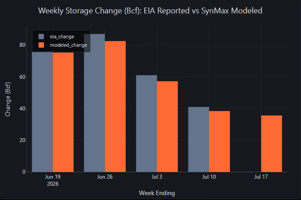
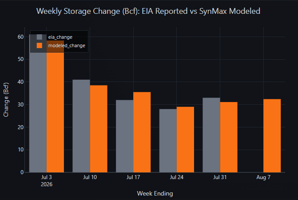
Against the latest EIA print, the SynMax storage-number model called +32.4 Bcf for the week ending August 28 versus the EIA-reported +30 Bcf, a +2.4 Bcf miss on the high side, in line with the model's tight tracking through late summer. The re-acceleration into September is a supply signature: Canadian imports and domestic production both firmed while cooling demand plateaued.
Model accuracy: Across the full scored window since July 3 (nine weeks, CONUS), the SynMax storage-number model has averaged a mean absolute error (MAE) of 4.1 Bcf, a modest negative (under-injection) bias of -1.4 Bcf, and a 0.96 correlation with EIA-reported changes. Over the last five weeks the MAE tightens to 2.9 Bcf with essentially zero bias (-0.0 Bcf).
| Week Ending | EIA (Bcf) | SynMax Model (Bcf) | Error |
|---|---|---|---|
| Jul 10 | +41 | +34.9 | -6.1 |
| Jul 17 | +32 | +31.4 | -0.6 |
| Jul 24 | +28 | +32.9 | +4.9 |
| Jul 31 | +33 | +31.7 | -1.3 |
| Aug 07 | +36 | +29.9 | -6.1 |
| Aug 14 | +16 | +18.5 | +2.5 |
| Aug 21 | +15 | +17.4 | +2.4 |
| Aug 28 | +30 | +32.4 | +2.4 |
The accuracy table reflects the latest SynMax supply/demand models and may differ modestly from the official weekly storage-number call scored directly against EIA releases.
Primary Driver: Supply Rebounds as Canadian Imports and Production Firm
The defining feature of the week ending September 4 was a rebound on the supply side. Total gross supply rose +1.57 Bcf/d WoW to 121.06 Bcf/d, led by a +0.88 Bcf/d recovery in Canadian pipeline imports to 8.65 Bcf/d and a +0.69 Bcf/d gain in dry gas production to 112.41 Bcf/d, a fresh high for the summer. With demand rising only modestly, the widening supply surplus drove the larger injection.
On the demand side, the story was one of rotation rather than direction. CONUS electric power demand eased -0.56 Bcf/d to 47.73 Bcf/d even as national cooling degree days firmed as the heat shifted north. Power burn jumped in the East (+1.42 Bcf/d to 19.93) and Midwest (+1.82 Bcf/d to 7.36) as late-summer warmth gripped the Mid-Atlantic and Great Lakes, but the South Central rolled over hard (-1.87 Bcf/d to 14.36) as Texas and the Gulf Coast finally cooled, and the Pacific (-1.21) and Mountain (-0.70) both faded. The net was a slightly lower national burn.
Partial demand offsets came from residential/commercial load (+0.91 Bcf/d to 8.78 Bcf/d) and LNG feedgas (+0.91 Bcf/d to 18.72 Bcf/d), but these were not enough to keep pace with the supply surge, so the weekly balance loosened and the injection climbed.
Weather Context
National population-weighted CDDs averaged 12.2 for the week ending September 4, up from 11.1 the prior week and well above the year-ago 7.2:
- National cooling demand firmed week-over-week as late-summer heat lingered into early September, concentrated in the populous East and Midwest
- The pattern rotated northward: the South Central, Pacific, and Mountain all cooled while the East and Midwest heated up — leaving national power burn essentially flat despite the higher headline CDD count
- Year-over-year, the +5.0 CDD gap (12.2 vs 7.2) continues to map onto the +5.92 Bcf/d YoY increase in power burn, confirming demand strength remains predominantly weather-driven
Supply & Demand Factor Changes (WoW)
| Factor | WE 8/28 (Bcf/d) | WE 9/04 (Bcf/d) | Δ WoW | Impact |
|---|---|---|---|---|
| SUPPLY | ||||
| Dry Gas Production | 111.72 | 112.41 | +0.69 | Bearish |
| Canada Pipeline Imports | 7.78 | 8.65 | +0.88 | Bearish |
| Total Gross Supply | 119.49 | 121.06 | +1.57 | Bearish |
| DEMAND | ||||
| Electric Power | 48.29 | 47.73 | -0.56 | Bearish |
| Industrial | 21.74 | 21.82 | +0.07 | Neutral |
| Res/Com | 7.86 | 8.78 | +0.91 | Bullish |
| LNG Feedgas (exports) | 17.81 | 18.72 | +0.91 | Bullish |
| Mexico Pipeline Exports | 7.66 | 7.26 | -0.41 | Bearish |
| Canada Pipeline Exports | 2.83 | 2.52 | -0.31 | Bearish |
| Lease/Plant/Pipe/Vehicle | 8.40 | 8.50 | +0.11 | Neutral |
| Total Demand | 114.60 | 115.33 | +0.72 | Bullish |
| Balancing Factor | +0.26 | +0.13 | -0.13 | — |
| Implied Daily Surplus | 4.63 | 5.61 | +0.97 | |
| Weekly Injection (Bcf) | +32.4 | +39.2 | +6.8 |
Note: Canadian pipeline imports are treated as a supply source; Canadian pipeline exports are treated as demand (gas leaving the domestic market). The Balancing Factor captures the residual between independently modeled supply and demand components and is reported below the totals — it is folded into the implied change but excluded from Total Supply and Total Demand.
Secondary Factors
Residential/Commercial & LNG Feedgas: Twin Offsets
Combined Res/Com demand rose +0.91 Bcf/d to 8.78 Bcf/d and total LNG feedgas rose +0.91 Bcf/d to 18.72 Bcf/d, together the two largest demand-side gains of the week. The Res/Com uptick reflects early-season heating load beginning to stir in the northern tier as the calendar turns, while feedgas firmed as Gulf Coast terminals ran near capacity. Both were bullish (tightening) factors, but their combined ~1.8 Bcf/d gain was outrun by the ~1.6 Bcf/d rise in supply.
Mexico Exports & Industrial
Pipeline exports to Mexico eased -0.41 Bcf/d to 7.26 Bcf/d, a bearish factor as cross-border cooling demand softened. Industrial demand was essentially flat at 21.82 Bcf/d (+0.07 WoW), a non-factor in the weekly balance.
Regional Power Burn
| Region | WE 8/28 (Bcf/d) | WE 9/04 (Bcf/d) | Δ WoW | LY (Bcf/d) | YoY Δ |
|---|---|---|---|---|---|
| East | 18.52 | 19.93 | +1.42 | 16.61 | +3.32 |
| Midwest | 5.55 | 7.36 | +1.82 | 4.37 | +2.99 |
| South Central | 16.23 | 14.36 | -1.87 | 13.35 | +1.01 |
| Mountain | 4.40 | 3.70 | -0.70 | 4.01 | -0.31 |
| Pacific | 3.60 | 2.39 | -1.21 | 3.49 | -1.09 |
| CONUS | 48.29 | 47.73 | -0.55 | 41.82 | +5.92 |
The heat rotated decisively northward: the East and Midwest together added more than 3 Bcf/d of power burn week-over-week, while the South Central, Pacific, and Mountain all faded. Every region except the Pacific and Mountain still ran above year-ago levels, keeping the CONUS YoY gain at a robust +5.92 Bcf/d.
Methodology & Data Sources
Storage change is modeled as Total Supply (Dry Gas Production + Canadian Pipeline Imports + LNG Imports) minus Total Demand (all consumption sectors + LNG feedgas exports + pipeline exports), with the Balancing Factor added as a calibration residual, multiplied by seven days. The EIA storage week runs Saturday through Friday (the week ending September 4 covers Saturday August 29 through Friday September 4). Canadian pipeline imports are treated as a supply source supplementing domestic production; Canadian pipeline exports are treated as demand. The Balancing Factor (+0.13 Bcf/d this week) represents the residual between independently modeled supply and demand components and calibrates the injection estimate against EIA actuals.
Data sources: SynMax daily production model (hdl.daily_production), SynMax demand model (hdl.gas_demand, baseline scenarios), SynMax LNG feedgas model (hdl.lng_feed_gas), EIA Weekly Natural Gas Storage Report, NOAA GFS/HRRR weather data.
Disclaimer: This report is produced by SynMax Analytics for informational purposes only. Modeled figures are estimates and may differ from official EIA releases. Past model accuracy does not guarantee future performance.