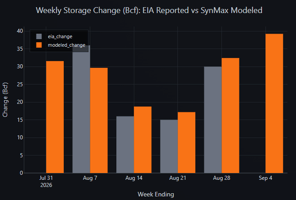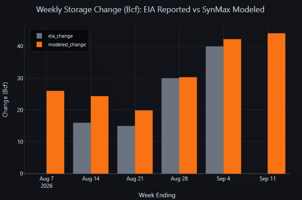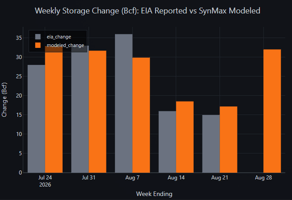
Week Ending August 28, 2026
Weekly Storage and S/D Brief - Week Ending 10/9/2026
Week Ending October 9, 2026
SynMax Analytics | Published October 14, 2026
Headline
SynMax models a +73 Bcf injection for the week ending October 9, down 12 Bcf from the prior week's EIA-reported +85 Bcf build. If confirmed, working gas storage would stand at 3,573 Bcf, 140 Bcf below last year's pace but 63 Bcf (+1.8%) above the five-year average.
Review the full analysis on the dashboard.
Storage Summary
Unlike the demand-led loosening that defined September, this week's pullback is supply-led as total gross supply fell 1.81 Bcf/d WoW to 116.41 Bcf/d with dry gas production slipping 0.95 Bcf/d to 109.30 Bcf/d and Canadian pipeline imports easing 0.86 Bcf/d to 7.11 Bcf/d. Demand fell only modestly (-0.60 Bcf/d to 105.53 Bcf/d): power burn extended its autumn slide -1.26 Bcf/d to 37.05 Bcf/d, but Res/Com demand jumped +0.99 Bcf/d to 10.56 Bcf/d as the first real heating load of the season stirred across the northern tier.
Model accuracy: Across the full scored window since July 3 (fourteen weeks, CONUS), the SynMax storage-number model has averaged a mean absolute error (MAE) of 3.7 Bcf, a small positive (over-injection) bias of +0.6 Bcf, and a 0.97 correlation with EIA-reported changes. Over the last five weeks the MAE has held near 2.9 Bcf (bias +1.0 Bcf), with the big-build weeks of late September the main source of dispersion.
| Week Ending | EIA (Bcf) | SynMax Model (Bcf) | Error |
|---|---|---|---|
| Sep 04 | +40 | +41.6 | +1.6 |
| Sep 11 | +44 | +44.9 | +0.9 |
| Sep 18 | +53 | +54.1 | +1.1 |
| Sep 25 | +64 | +70.4 | +6.4 |
| Oct 02 | +85 | +80.2 | -4.8 |
The accuracy table reflects SynMax’s latest supply/demand models and the resulting weekly storage may differ modestly from the official weekly storage-number call scored directly against EIA releases.
Primary Driver: Supply Pulls Back as Heating Load Begins to Stir
Total gross supply fell -1.81 Bcf/d WoW to 116.41 Bcf/d, its sharpest weekly decline in several weeks, as dry gas production eased -0.95 Bcf/d to 109.30 Bcf/d with reduced volumes in multiple regions. In the Gulf, Hurricane Isaias led to roughly 0.5 Bcf/d of lost production over a four day period. Meanwhile, seasonal pipeline maintenance, force majeures, and price related choke backs all combined to keep Northeast production around 34 Bcf/d for the week. Additionally, Canadian pipeline imports gave back -0.86 Bcf/d to 7.11 Bcf/d, likely also related to weak physical prices in the Northeast.
On the demand side, the picture was mixed rather than uniformly loosening. CONUS electric power burn continued its orderly slide, down 1.26 Bcf/d to 37.05 Bcf/d, even as national population-weighted CDDs held essentially flat at 5.3 (vs 5.3 the prior week). That was offset by a 0.99 Bcf/d jump in Res/Com demand to 10.56 Bcf/d as heating degree days rose to 3.2 from 2.3 and the first meaningful early-season heating load arrived across the northern tier. Industrial demand firmed +0.23 Bcf/d to 22.50 Bcf/d. Net total demand slipped only -0.60 Bcf/d to 105.53 Bcf/d.
Weather Context
National population-weighted CDDs averaged 5.3 for the week ending October 9, essentially unchanged from the prior week and running +1.0 above the year-ago 4.4:
- Cooling demand has effectively bottomed, holding flat near its seasonal floor as the last of the warm-season load drains out of the southern tier
- Heating degree days rose to 3.2 (from 2.3 the prior week, and near the year-ago 3.4) — the first week early-season heating load meaningfully registered, concentrated across the northern tier
- The weather signal is now bidirectional: cooling does still have further to decline, but the balance from here is increasingly set on the heating side, where even a modest early-autumn cold push adds tightening
Supply & Demand Factor Changes (WoW)
| Factor | WE 10/02 (Bcf/d) | WE 10/09 (Bcf/d) | Δ WoW | Impact |
|---|---|---|---|---|
| SUPPLY | ||||
| Dry Gas Production | 110.25 | 109.30 | -0.95 | Bullish |
| Canada Pipeline Imports | 7.97 | 7.11 | -0.86 | Bullish |
| Total Gross Supply | 118.22 | 116.41 | -1.81 | Bullish |
| DEMAND | ||||
| Electric Power | 38.32 | 37.05 | -1.26 | Bearish |
| Industrial | 22.28 | 22.50 | +0.23 | Bullish |
| Res/Com | 9.56 | 10.56 | +0.99 | Bullish |
| LNG Feedgas (exports) | 18.45 | 18.05 | -0.40 | Bearish |
| Mexico Pipeline Exports | 6.94 | 7.03 | +0.10 | Bullish |
| Canada Pipeline Exports | 2.56 | 2.35 | -0.21 | Bearish |
| Lease/Plant/Pipe/Vehicle | 8.03 | 7.98 | -0.04 | Bearish |
| Total Demand | 106.13 | 105.53 | -0.60 | Bearish |
| Balancing Factor | +0.63 | +0.53 | -0.10 | — |
| Implied Daily Surplus | 11.46 | 10.36 | -1.11 | |
| Weekly Injection (Bcf) | +80.2 | +72.5 | -7.8 |
Note: Canadian pipeline imports are treated as a supply source; Canadian pipeline exports are treated as demand (gas leaving the domestic market). The Balancing Factor captures the residual between independently modeled supply and demand components and is reported below the totals — it is folded into the implied change but excluded from Total Supply and Total Demand.
Secondary Factors
Res/Com: First Heating Load of the Season Arrives
Combined Res/Com demand climbed +0.99 Bcf/d to 10.56 Bcf/d, the single largest mover on the week and the clearest bullish (tightening) signal in the balance. With HDDs rising to 3.2 from 2.3, early-season heating load finally registered across the northern tier as Res/Com is now a pivotal swing factor heading into the back half of October.
LNG Feedgas, Mexico Exports & Industrial
Total LNG feedgas eased -0.40 Bcf/d to 18.05 Bcf/d as Freeport LNG was down roughly 1 Bcf/d from the prior week. This more than offset small WoW gains from Sabine Pass, Calcasieu Pass, and Golden Pass. Pipeline exports to Mexico firmed +0.10 Bcf/d to 7.03 Bcf/d while industrial demand ticked up +0.23 Bcf/d to 22.50 Bcf/d. The secondary factors roughly offset one another, leaving the supply pullback and the Res/Com stir as the two decisive forces on the week.
Regional Power Burn
| Region | WE 10/02 (Bcf/d) | WE 10/09 (Bcf/d) | Δ WoW | LY (Bcf/d) | YoY Δ |
|---|---|---|---|---|---|
| East | 15.09 | 14.13 | -0.96 | 15.26 | -1.13 |
| Midwest | 4.78 | 4.13 | -0.65 | 4.14 | -0.01 |
| South Central | 12.74 | 12.27 | -0.48 | 11.55 | +0.72 |
| Mountain | 3.01 | 3.22 | +0.21 | 3.02 | +0.20 |
| Pacific | 2.70 | 3.31 | +0.61 | 2.06 | +1.25 |
| CONUS | 38.32 | 37.05 | -1.26 | 36.03 | +1.02 |
Power burn fell across the eastern half of the country with the East (-0.96) and Midwest (-0.65) regions shedding the most as northern cooling load drained away. At the national level, CONUS power burn held +1.02 Bcf/d above last year despite the weekly decline, keeping the autumn power-burn comparison firmer than the headline slide implies.
Outlook: Week Ending October 16
Current modeling for the week ending October 16 points to an injection of 85 Bcf.
- Supply rebound: A return to pre-storm levels in the gulf and a slight rebound in the Northeast (coinciding with the return of Cove Point LNG) have combined with minor increases in Canadian imports for a modest weekly increase in total supply.
- Power demand declines: Weaker burns have been observed across the eastern two-thirds of the country this week, but have been most notable in the Gulf region as a lingering result of Hurricane Isaias
- LNG feedgas firm: A partial recovery at Freeport, a full recovery at Cove Point, and new highs at Golden Pass combine to push total feedgas up 1.3 Bcf/d WoW
Methodology & Data Sources
Storage change is modeled as Total Supply (Dry Gas Production + Canadian Pipeline Imports + LNG Imports) minus Total Demand (all consumption sectors + LNG feedgas exports + pipeline exports), with the Balancing Factor added as a calibration residual, multiplied by seven days. The EIA storage week runs Saturday through Friday (the week ending October 9 covers Saturday October 3 through Friday October 9). Canadian pipeline imports are treated as a supply source supplementing domestic production; Canadian pipeline exports are treated as demand. The Balancing Factor (+0.53 Bcf/d this week) represents the residual between independently modeled supply and demand components and calibrates the injection estimate against EIA actuals.
Data sources: SynMax daily production model (hdl.daily_production), SynMax demand model (hdl.gas_demand, baseline scenarios), SynMax LNG feedgas model (hdl.lng_feed_gas), EIA Weekly Natural Gas Storage Report (hdl.eia_storage_final), NOAA GFS/HRRR weather data.
Disclaimer: This report is produced by SynMax Analytics for informational purposes only. Modeled figures are estimates and may differ from official EIA releases. Past model accuracy does not guarantee future performance.