Week Ending August 28, 2026
Weekly Storage and S/D Brief - Week Ending 10/23/2026
Week Ending October 23, 2026
SynMax Analytics | Published October 28, 2026
Headline
SynMax models a +74 Bcf injection for the week ending October 23, down 3 Bcf from the prior week's EIA-reported +77 Bcf build. If confirmed, working gas storage would stand at 3,718 Bcf. That is 154 Bcf below last year's level (3,872 Bcf) but roughly 34 Bcf (+0.9%) above the five-year average. The modeled build aligns with last year's +74 Bcf for the same week and the five-year average of about +76 Bcf.
Review the full analysis on the dashboard.
Storage Summary
Last week's build was driven by a collapse in power burn. This week, the first real heating load of the season absorbs that slack. Total demand rose 2.32 Bcf/d WoW to 107.26 Bcf/d, as a 4.63 Bcf/d jump in Res/Com demand to 15.46 Bcf/d more than offset a further 4.00 Bcf/d drop in CONUS power burn to 30.63 Bcf/d. Supply limited the tightening: total gross supply rose 1.08 Bcf/d to 118.37 Bcf/d, led by a 1.62 Bcf/d rebound in dry gas production to 111.35 Bcf/d, mostly in the Northeast. LNG feedgas climbed a further 0.73 Bcf/d to 20.62 Bcf/d, its highest weekly level ever.
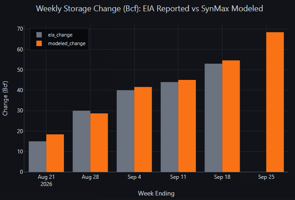
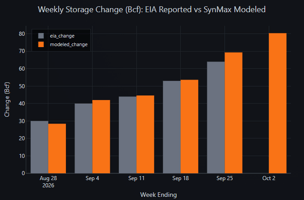
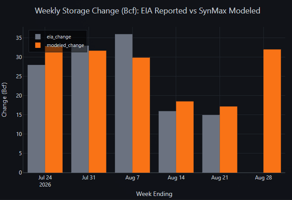
Model accuracy: Across the full scoring window since July 3 (fifteen weeks, CONUS), the SynMax storage-number model has averaged a mean absolute error (MAE) of 4.1 Bcf, with a positive (over-injection) bias of +1.1 Bcf. Over the last five weeks the MAE was 4.6 Bcf, with a +2.6 Bcf bias. The model has overestimated the build in three of the last four weeks, most notably the week ending October 16. Last week's brief called +88 Bcf; the latest model run puts that week at +84.3 Bcf, against an EIA-reported +77 Bcf.
As mentioned in Tuesday morning's email, SynMax has recently implemented improvements to our power burn modeling. The update makes better use of the latest hourly grid data (EIA-930) and assigns gas-fired generation to regions more precisely. As a result, our daily Electric Power estimates settle faster and are more stable from one run to the next, especially in the South Central region. This update is the primary reason for the change in modeled storage for last week from +88 to +84.
| Week Ending | EIA (Bcf) | SynMax Model (Bcf) | Error |
|---|---|---|---|
| Sep 18 | +53 | +50.9 | -2.1 |
| Sep 25 | +64 | +69.4 | +5.4 |
| Oct 02 | +85 | +82.0 | -3.0 |
| Oct 09 | +67 | +72.2 | +5.2 |
| Oct 16 | +77 | +84.3 | +7.3 |
The accuracy table reflects SynMax's latest supply/demand models. Modeled weekly values are recalculated as source data updates, so the resulting weekly storage may differ modestly from the official weekly storage-number call scored directly against EIA releases.
Primary Driver: Heating Season Arrives as Power Burn Keeps Falling
Res/Com demand jumped 4.63 Bcf/d WoW to 15.46 Bcf/d. This was the largest single weekly move of the autumn, and it brought Res/Com back in line with last year (15.54 Bcf/d) after several weeks running roughly 2 Bcf/d below. Most of the gain came from the East (+2.92 Bcf/d to 6.83) and the Midwest (+1.44 Bcf/d to 3.81), as a cold front moved through the eastern half of the country over the October 17-18 weekend.
The same cooling took out most of the remaining cooling load. CONUS electric power burn fell 4.00 Bcf/d to 30.63 Bcf/d, and is now 1.02 Bcf/d below year-ago levels for the first time since late September. The East (-2.10 Bcf/d) and South Central (-1.68 Bcf/d) accounted for almost all of the decline. Net, the Res/Com gain outweighed the power-burn loss by about 0.6 Bcf/d. Industrial demand also rose 0.93 Bcf/d to 23.35 Bcf/d, its highest weekly level this autumn, consistent with cooler temperatures.
On the supply side, dry gas production rose 1.62 Bcf/d to 111.35 Bcf/d. The Northeast drove the gain, rebounding 1.78 Bcf/d to 35.44 Bcf/d after several weeks of declines, and is now back above year-ago levels (+0.34 Bcf/d). Gulf production held at 44.13 Bcf/d, and the West slipped 0.20 Bcf/d. Canadian pipeline imports fell 0.54 Bcf/d to 7.02 Bcf/d, partly offsetting the production gain.
Net, the daily surplus narrowed 1.51 Bcf/d to 10.53 Bcf/d, bringing the modeled injection down to +73.7 Bcf from the +84.3 Bcf model value for the prior week (+77 Bcf EIA-reported).
Weather Context
National population-weighted HDDs averaged 8.2 for the week ending October 23, more than double the prior week's 3.6 and above the year-ago 7.6:
- Cooling degree days fell to 1.3 from 4.5, and the national average temperature dropped almost 8°F to 58.1°F. CONUS HDDs peaked at 11.0 on October 18.
- The cold was concentrated in the large eastern heating markets. HDDs rose to 10.7 in the East (from 2.8) and 10.2 in the Midwest (from 3.8). South Central turned sharply cooler (CDD 2.0 vs 10.6), which drove its power-burn decline.
- The West moved the other way. The Mountain region warmed (HDD 6.5 vs 8.9) and the Pacific was flat, reversing last week's east-west split. With heating demand now concentrated in the East and Midwest, the national Res/Com response was much larger than last week's.
Supply & Demand Factor Changes (WoW)
| Factor | WE 10/16 (Bcf/d) | WE 10/23 (Bcf/d) | Δ WoW | Impact |
|---|---|---|---|---|
| SUPPLY | ||||
| Dry Gas Production | 109.73 | 111.35 | +1.62 | Bearish |
| Canada Pipeline Imports | 7.56 | 7.02 | -0.54 | Bullish |
| Total Gross Supply | 117.29 | 118.37 | +1.08 | Bearish |
| DEMAND | ||||
| Electric Power | 34.63 | 30.63 | -4.00 | Bearish |
| Industrial | 22.42 | 23.35 | +0.93 | Bullish |
| Res/Com | 10.83 | 15.46 | +4.63 | Bullish |
| LNG Feedgas (exports) | 19.90 | 20.62 | +0.73 | Bullish |
| Mexico Pipeline Exports | 6.86 | 6.72 | -0.14 | Bearish |
| Canada Pipeline Exports | 2.41 | 2.43 | +0.02 | Bullish |
| Lease/Plant/Pipe/Vehicle | 7.91 | 8.05 | +0.14 | Bullish |
| Total Demand | 104.94 | 107.26 | +2.32 | Bullish |
| Balancing Factor | +0.30 | +0.58 | +0.27 | — |
| Implied Daily Surplus | 12.04 | 10.53 | -1.51 | |
| Weekly Injection (Bcf) | +84.3 | +73.7 | -10.5 |
Note: Canadian pipeline imports are treated as a supply source; Canadian pipeline exports are treated as demand (gas leaving the domestic market). The Balancing Factor captures the residual between independently modeled supply and demand components and is reported below the totals. It is folded into the implied change but excluded from Total Supply and Total Demand. Prior-week values reflect the latest model run and may differ slightly from last week's brief.
Secondary Factors
LNG Feedgas: Plaquemines, Sabine Pass and Golden Pass Push Exports Higher
Total LNG feedgas rose 0.73 Bcf/d to 20.62 Bcf/d, running 2.47 Bcf/d above the year-ago 18.15 Bcf/d. Plaquemines added 0.28 Bcf/d to 4.31 Bcf/d, and Sabine Pass added 0.27 Bcf/d to 4.97 Bcf/d. Cove Point ran its first full week back from maintenance at 0.80 Bcf/d (+0.23). Golden Pass added 0.19 Bcf/d to 0.75 Bcf/d and set a new daily high of 0.80 Bcf/d on October 22 as its ramp continued. Freeport was the main offset, slipping 0.20 Bcf/d to 1.99 Bcf/d for the week as flows dipped to 1.5 Bcf on October 20.
Industrial, Mexico Exports & Canadian Flows
Industrial demand rose 0.93 Bcf/d to 23.35 Bcf/d, about 1 Bcf/d above last year's 22.38 Bcf/d. Pipeline exports to Mexico eased a further 0.14 Bcf/d to 6.72 Bcf/d, continuing their seasonal autumn decline. Canadian pipeline imports fell 0.54 Bcf/d, reversing most of last week's recovery. Together these factors were bullish on the week, adding to the tightening from heating demand and LNG.
Regional Power Burn
| Region | WE 10/16 (Bcf/d) | WE 10/23 (Bcf/d) | Δ WoW | LY (Bcf/d) | YoY Δ |
|---|---|---|---|---|---|
| East | 14.50 | 12.40 | -2.10 | 13.96 | -1.56 |
| Midwest | 4.46 | 3.85 | -0.61 | 3.72 | +0.13 |
| South Central | 10.51 | 8.83 | -1.68 | 9.31 | -0.48 |
| Mountain | 2.70 | 2.72 | +0.02 | 2.66 | +0.06 |
| Pacific | 2.46 | 2.83 | +0.38 | 2.01 | +0.82 |
| CONUS | 34.63 | 30.63 | -4.00 | 31.65 | -1.02 |
Power burn fell in the regions where the cold front arrived. The East (-2.10) and South Central (-1.68) led the decline, and the Midwest fell 0.61 Bcf/d. Only the West edged higher, with the Pacific up 0.38 Bcf/d on warmer weather. The East is now 1.56 Bcf/d below last year, and CONUS power burn has dropped back below year-ago levels (-1.02 Bcf/d) for the first time since late September. That removes the year-on-year demand cushion that had supported balances for most of the summer and early autumn.
Outlook: Week Ending October 30
Early data for the week ending October 30 (five of seven days, through October 28) point to a build of +76 Bcf, roughly in line with this week. Heating demand has eased slightly from its weekend peak, and the Freeport outage trimmed LNG demand.
- Res/Com eases: Res/Com demand is averaging about 14.6 Bcf/d week-to-date, down about 0.9 Bcf/d, as CONUS HDDs settled near 7 after the October 17-18 cold snap.
- Power burn steadies: Power burn has recovered modestly to about 31.9 Bcf/d week-to-date (+1.3 Bcf/d).
- Supply firm: Dry gas production is averaging about 111.1 Bcf/d week-to-date, close to this week's level.
- LNG feedgas near 20.5 Bcf/d: Freeport feedgas fell to near zero (0.02 Bcf/d) on October 26 before recovering to about 2.1 Bcf/d by October 28. Golden Pass also briefly dipped to 0.54 Bcf/d on October 25. Separately, Corpus Christi feedgas rose above 4.0 Bcf/d on October 27, a new all time high.
- Weather ahead: The latest forecast keeps CONUS HDDs in a 5.5-8.3 range through early November, so heating load stays roughly at current levels without a step change.
Early read: +76 Bcf based on week-to-date fundamentals and modeled s/d for the balance of the week. That compares with a +33 Bcf build in the same week last year, so the year-on-year storage deficit would narrow sharply, to roughly 111 Bcf.
Methodology & Data Sources
Storage change is modeled as Total Supply (Dry Gas Production + Canadian Pipeline Imports + LNG Imports) minus Total Demand (all consumption sectors + LNG feedgas exports + pipeline exports), net of the Balancing Factor calibration residual, multiplied by seven days. The EIA storage week runs Saturday through Friday; the week ending October 23 covers Saturday, October 17 through Friday, October 23. Canadian pipeline imports are treated as a supply source supplementing domestic production, and Canadian pipeline exports are treated as demand. The Balancing Factor (+0.58 Bcf/d this week) is the residual between independently modeled supply and demand components and calibrates the injection estimate against EIA actuals.
Data sources: SynMax daily production model (hdl.daily_production), SynMax demand model (hdl.gas_demand, baseline scenarios), SynMax LNG feedgas model (hdl.lng_feed_gas), EIA Weekly Natural Gas Storage Report (hdl.eia_storage_final), NOAA GFS/HRRR weather data.
Disclaimer: This report is produced by SynMax Analytics for informational purposes only. Modeled figures are estimates and may differ from official EIA releases. Past model accuracy does not guarantee future performance.