Week Ending August 28, 2026
Weekly Storage and S/D Brief - Week Ending 9/25/2026
Week Ending September 25, 2026
SynMax Analytics | Published September 30, 2026
Headline
SynMax is modeling a +68 Bcf injection for the week ending September 25, up 15 Bcf from the prior week's EIA-reported +53 Bcf build and the largest build since June. The loosening is once again demand-led, but this week marks a turning point: total demand fell -2.06 Bcf/d WoW to 109.43 Bcf/d as power burn collapsed -3.58 Bcf/d to 40.36 Bcf/d, dropping below the year-ago level as cooling demand faded into autumn. Supply eased more modestly (-0.82 Bcf/d to 118.52 Bcf/d) as dry gas production slipped -1.34 Bcf/d to 111.05 Bcf/d, partly offset by a +0.52 Bcf/d rebound in Canadian pipeline imports to 7.47 Bcf/d. The daily surplus widened to 9.77 Bcf/d. If confirmed, working gas storage would stand at 3,419 Bcf, 132 Bcf below last year's pace and 98 Bcf (+3.0%) above the five-year average.
Review the full analysis on the dashboard.
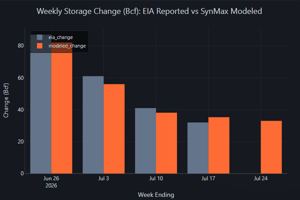
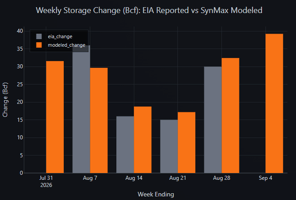
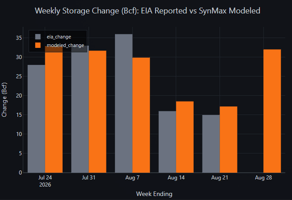
Model accuracy: Across the past 4 weeks, the SynMax storage-number model has averaged a mean absolute error (MAE) of 1.1 Bcf, with each week realizing slightly lower than modeled.
| Week Ending | EIA (Bcf) | SynMax Model (Bcf) | Error |
|---|---|---|---|
| Aug 28 | +30 | +30.2 | +0.2 |
| Sep 04 | +40 | +41.6 | +1.6 |
| Sep 11 | +44 | +45.0 | +1.0 |
| Sep 18 | +53 | +54.6 | +1.6 |
The accuracy table reflects the latest SynMax supply and demand models and may differ modestly from the official weekly storage-number call scored directly against EIA releases.
Primary Driver: Cooling Demand Falls Below Year-Ago
The defining feature of the week ending September 25 was a decisive break in cooling demand. Total demand fell -2.06 Bcf/d WoW to 109.43 Bcf/d, led by a -3.58 Bcf/d plunge in CONUS electric power burn to 40.36 Bcf/d as national cooling degree days dropped into the low single digits. Average national population-weighted CDDs fell to 6.1 from 9.2 the prior week and below last year’s 7.2 CDDs. This is the first week since June in which the cooling load ran below last year.
The cooldown was broad but concentrated in the East and Midwest this week. Power burn fell hardest in the East (-2.84 Bcf/d to 15.49) as the late-season Mid-Atlantic warm-up broke, and in the Midwest (-0.94 Bcf/d to 5.09). The South Central was the lone gainer (+0.26 Bcf/d to 13.93) as residual Texas and Gulf Coast heat kept the regional cooling load firm.
On the supply side, dry gas production dropped to just over 111 Bcf/d for the week, down 1.8 Bcf/d from the highs set 2 weeks prior. Northeast volumes continued to struggle and were further hampered by the force majeure outage on TC Energy’s 1.8 Bcf/d Mountaineer XPress pipeline in West Virginia from 9/24 through 9/27. The production retreat was partly cushioned by a +0.52 Bcf/d rebound in Canadian pipeline imports to 7.47 Bcf/d.
Weather Context
National population-weighted CDDs averaged 6.1 for the week ending September 25, down sharply from 9.2 the prior week and below the year-ago 7.2:
- National cooling demand collapsed week-over-week as the last of summer's heat broke across the East and Midwest, pulling the national CDD count into the low single digits
- The retreat was led by the East and Midwest this week, while lingering Texas and Gulf Coast heat kept the South Central marginally firmer
- Year-over-year, cooling demand flipped negative (6.1 vs 7.2 CDDs), the driver behind power burn slipping -1.86 Bcf/d below last year
Supply & Demand Factor Changes (WoW)
| Factor | WE 9/18 (Bcf/d) | WE 9/25 (Bcf/d) | Δ WoW | Impact |
|---|---|---|---|---|
| SUPPLY | ||||
| Dry Gas Production | 112.39 | 111.05 | -1.34 | Bullish |
| Canada Pipeline Imports | 6.95 | 7.47 | +0.52 | Bearish |
| Total Gross Supply | 119.34 | 118.52 | -0.82 | Bullish |
| DEMAND | ||||
| Electric Power | 43.94 | 40.36 | -3.58 | Bearish |
| Industrial | 22.11 | 22.35 | +0.25 | Bullish |
| Res/Com | 8.62 | 9.90 | +1.28 | Bullish |
| LNG Feedgas (exports) | 19.07 | 18.71 | -0.36 | Bearish |
| Mexico Pipeline Exports | 6.88 | 7.32 | +0.44 | Bullish |
| Canada Pipeline Exports | 2.57 | 2.64 | +0.07 | Bullish |
| Lease/Plant/Pipe/Vehicle | 8.29 | 8.15 | -0.14 | Bearish |
| Total Demand | 111.48 | 109.43 | -2.06 | Bearish |
| Balancing Factor | +0.06 | -0.68 | -0.74 | — |
| Implied Daily Surplus | 7.80 | 9.77 | +1.97 | |
| Weekly Injection (Bcf) | +54.6 | +68.4 | +13.8 |
Note: Canadian pipeline imports are treated as a supply source; Canadian pipeline exports are treated as demand (gas leaving the domestic market). The Balancing Factor captures the residual between independently modeled supply and demand components and is reported below the totals — it is folded into the implied change but excluded from Total Supply and Total Demand.
Secondary Factors
Res/Com: Heating Load Stirs
Combined Res/Com demand jumped +1.28 Bcf/d to 9.90 Bcf/d as the autumn cooldown lit the first meaningful early-season heating load across the northern tier.
LNG Feedgas, Mexico Exports & Industrial
Total LNG feedgas eased -0.36 Bcf/d to 18.71 Bcf/d as Gulf Coast terminals dipped modestly from full utilization. Pipeline exports to Mexico and Industrial demand each increased on the week, with Mexican exports climbing 0.44 Bcf/d to 7.32 Bcf/d, and Industrial up +0.25 Bcf/d to 22.35 Bcf/d.
Regional Power Burn
| Region | WE 9/18 (Bcf/d) | WE 9/25 (Bcf/d) | Δ WoW | LY (Bcf/d) | YoY Δ |
|---|---|---|---|---|---|
| East | 18.32 | 15.49 | -2.84 | 17.72 | -2.24 |
| Midwest | 6.03 | 5.09 | -0.94 | 5.33 | -0.24 |
| South Central | 13.68 | 13.93 | +0.26 | 12.88 | +1.06 |
| Mountain | 3.51 | 3.26 | -0.25 | 3.58 | -0.32 |
| Pacific | 2.41 | 2.59 | +0.18 | 2.70 | -0.11 |
| CONUS | 43.94 | 40.36 | -3.58 | 42.22 | -1.86 |
The heat broke across the East and Midwest this week, which together shed nearly 3.8 Bcf/d of power burn. Only the South Central rose, as lingering Gulf Coast heat kept Texas power demand firm. With the East, Midwest, Mountain and Pacific all now running below year-ago levels, CONUS power burn slipped -1.86 Bcf/d under last year.
Outlook: Week Ending October 2
Early indications for the week ending October 2 point to an injection of +75 Bcf as the cooling demand continues to decline and production volumes remain depressed relative to recent highs.
- Cooling demand moderates: As we transition to October, power burn will continue to decline before stabilizing near 30 Bcf/d by the end of the month
- Heating load building: Early-season Res/Com heating demand is now the key swing factor as a colder-than-normal start to October could add several Bcf/d of tightening and trim the build
- Production watch: Dry gas output eased to ~111 Bcf/d for week ending 9/25 and is averaging below 110 Bcf/d for the current gas week.
- LNG feedgas firm: Gulf Coast throughput near 19 Bcf/d remains a steady bullish anchor. Volumes are expected to rise to ~20 Bcf/d once the Cove Point LNG maintenance event is completed around 10/9.
Methodology & Data Sources
Storage change is modeled as Total Supply (Dry Gas Production + Canadian Pipeline Imports + LNG Imports) minus Total Demand (all consumption sectors + LNG feedgas exports + pipeline exports), with the Balancing Factor added as a calibration residual, multiplied by seven days. The EIA storage week runs Saturday through Friday (the week ending September 25 covers Saturday September 19 through Friday September 25). Canadian pipeline imports are treated as a supply source supplementing domestic production; Canadian pipeline exports are treated as demand. The Balancing Factor (-0.68 Bcf/d this week) represents the residual between independently modeled supply and demand components and calibrates the injection estimate against EIA actuals.
Data sources: SynMax daily production model (hdl.daily_production), SynMax demand model (hdl.gas_demand, baseline scenarios), SynMax LNG feedgas model (hdl.lng_feed_gas), EIA Weekly Natural Gas Storage Report, NOAA GFS/HRRR weather data.
Disclaimer: This report is produced by SynMax Analytics for informational purposes only. Modeled figures are estimates and may differ from official EIA releases. Past model accuracy does not guarantee future performance.