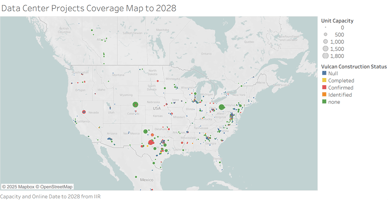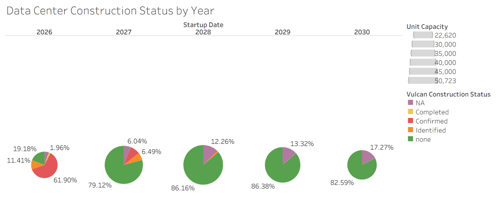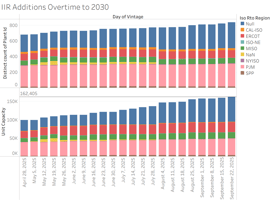
Data Center Demand and Project Execution Our IIR partners continue to rapidly expand their data...
A Teaser for the Forthcoming White Paper. Data-center facility coverage from Industrial Info Resources (IIR), with construction ground-truth from SynMax Vulcan satellite intelligence.
What This Paper Argues
Capital is pouring into AI compute on the assumption that gigawatts, data-center shells, and silicon will all arrive together. They will not. The full paper gives you a way to separate the infrastructure that captures scarcity rent from the infrastructure that ends up as stranded inventory, and to do it before the market reprices either one.
The megawatt is the scarce currency; silicon is the perishable commodity. The thesis follows from that asymmetry, but only if silicon outruns the grid. That condition is what the full paper sets out to test.
|
3-7 yrs Grid Lead-Time Utility interconnect & transformer queues |
12-18 mo Silicon Refresh Foundry & architecture iteration cycle |
39% Ghost Pipeline of U.S. GW promised in 2027 has not cleared land |
4.2× Heat-Rate Spread Tokens/sec per Watt, legacy vs. next-gen |
The Problem Hiding Inside the Boom
You have seen the announcements. SemiAnalysis models the U.S. datacenter build rising from +21 GW added in 2026 toward +84 GW per year by 2030 - roughly 114 GW of cumulative capacity by 2028, against a disclosed pipeline that runs north of 240 GW and announced projects exceeding 700 GW - more than the entire current U.S. peak load. What you have not seen is the attrition funnel underneath those numbers. Announced interconnection queues are not energized megawatts, and the gap between the two is where capital goes to die.
History has run this play three times already - merchant power (1998-2003), shale takeaway (2008-2015), and Bitcoin ASIC halvings (2016-2024). In every case, the bust did not land on the slow, physical, monopoly asset. It backed up onto the fast-moving, perishable one.
Ground Truth #1: What Has Actually Been Cleared
Announcements are not construction. Using SynMax Vulcan satellite verification against the IIR facility base, we measured the capacity that has actually broken ground, counting a unit only once its own land clearing is observed, from the start of 2025. The answer: roughly 46 GW of U.S. capacity - counted at the unit level, so only ground that has actually moved - cleared across six quarters.
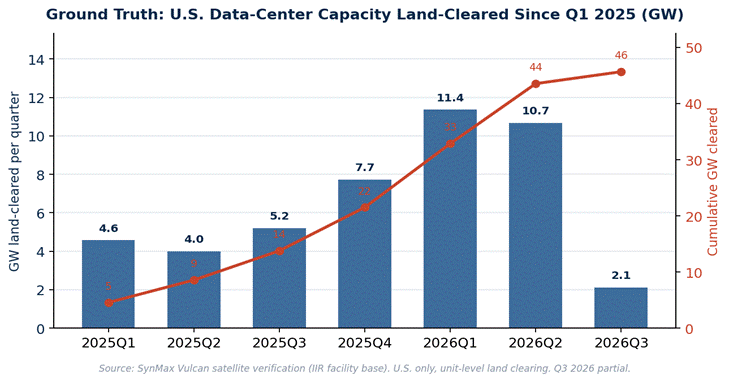
Figure 1 - U.S. capacity (GW) with satellite-verified land clearing per quarter, cumulative. Unit-level. Q3 2026 partial.
Ground Truth #2: The Ghost Pipeline
Now hold that against what has been promised, and notice where the gap opens. Of the U.S. capacity slated to come online in 2026, only 10% shows no satellite-observed ground activity, so the near-term buildout is largely real. For the 2027 cohort, 39% - roughly 14 GW - has not cleared a single acre. With grid interconnection and large-power-transformer lead times running 3-7 years, capacity that has not broken ground by late 2026 cannot realistically dispatch tokens in 2027. Much of the 2027 promise, in other words, is capacity that exists only on paper.
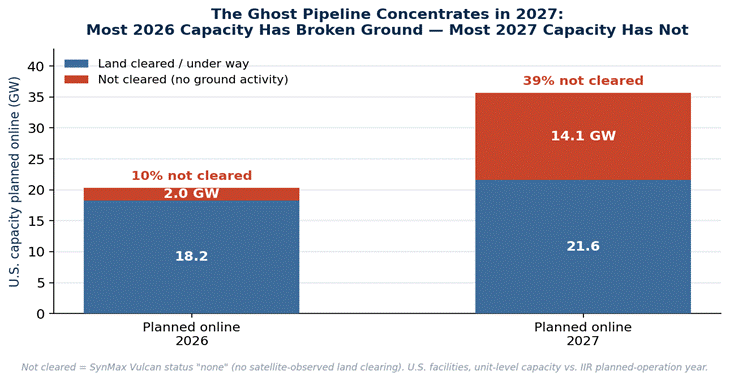
Figure 2 - U.S. capacity (GW) planned online in 2026 vs. 2027, split by satellite-observed ground activity. The un-cleared share jumps from 10% to 39%.
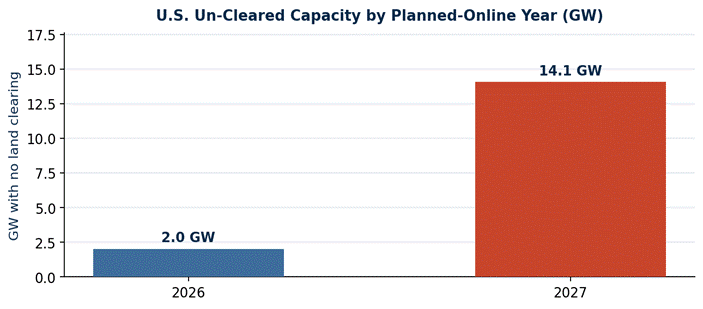
Figure 3 - U.S. un-cleared capacity (GW) by planned-online year. Vulcan status “none” - no observed land clearing.
Where the Consensus Gets It Wrong
The intuitive call is that a bust would punish powered land and transmission, the boring capital-heavy assets. It won't. Those assets have multi-decade lifespans and effectively no technological obsolescence, so they capture the scarcity rent. The damage lands upstream instead: on stranded silicon sitting unenergized in warehouses and on legacy GPUs pushed off fixed power envelopes by the next, more efficient generation. Bitcoin miners have run this same treadmill for a decade, and there is little reason to think AI hardware is exempt.
The Assumption This Rests On
It is worth being explicit about the hinge the thesis turns on. The stranded-silicon conclusion holds only if silicon is manufactured faster than the grid can energize it. If foundries instead pace capacity to energized demand, and semiconductor supply has been disciplined, even demand-constrained, for most of this cycle, then there is no glut. Added silicon gets absorbed, legacy GPUs keep earning because compute stays scarce, and the binding constraint becomes demand itself, which lifts all vintages rather than evicting the old.
That is not a footnote; it is the empirical question. It is also why the next phase of this work goes directly at the silicon side of the equation: tracking the semiconductor fab and packaging expansion projects themselves, rather than assuming their output. Mapping that build-out against verified grid energization is what shows whether the megawatt actually binds, or whether disciplined fabs quietly defuse the glut before it forms.
|
TWO POSSIBLE OUTCOMES If silicon outruns the grid: stranded chips, GPU eviction, collateral collapse (this paper's thesis). If disciplined fabs track energization: no glut; compute demand binds and every vintage keeps earning. |
Winners and Losers, in Brief
The full paper maps the whole value chain. The extremes are below.
|
Segment |
Bias |
Why |
|
Powered Land & Substation Rights |
Extreme Bullish |
Monopoly on the critical path; interconnection rights are effectively immortal. |
|
Liquid-Cooled Modular DCs |
Bullish |
Can refresh silicon indefinitely without expanding the power footprint. |
|
Leveraged GPU Cloud Providers |
Extreme Bearish |
Legacy fleets financed on 4-5 yr debt; face eviction at month 24-30. |
|
Air-Cooled Legacy DC Shells |
Bearish |
Rack densities capped; stranded without prohibitive retrofit capex. |
What the Full Paper Delivers
The complete white paper closes the loop on the chip-and-facility build side:
- The Silicon Heat Rate framework - a merit-order dispatch model for tokens-per-watt inside fixed utility envelopes, with a full 100 MW eviction economics table.
- Semiconductor expansion tracking - foundry, packaging, and HBM capacity coming online, mapped against verified grid energization.
- The GPU-backed debt trap - how 4-5 year amortization myths collide with 24-month eviction reality, mirrored on the crypto-mining lending blowups of 2022.
- Full value-chain impact matrix - segment-by-segment positioning, from substation rights to leveraged neoclouds.
HOW TO GET THE FULL PAPER
|
SynMax Vulcan Clients Included The full paper ships free to active Vulcan subscribers, alongside the underlying facility-level construction data behind every figure here. If you already have Vulcan, it will be delivered. |
Not Yet a Client $4,500/seat or $15K/enterprise Purchase the standalone report, or roll it into a Vulcan subscription and get the satellite-verified pipeline that produced it, refreshed continuously rather than as a one-time snapshot. |
Subscribe to SynMax Vulcan to track this pipeline in real time, not one report at a time. Contact David Bellman dbellman@synmax.com to reserve the paper or start a subscription or see a presentation of Vulcan.
The Bottom Line
The AI buildout is, at bottom, an energy problem wearing the costume of a computing revolution. The three prior cycles we examine all resolved the same way, with the bust settling on whichever asset was fastest to build and quickest to obsolete. If this glut forms, it settles on unenergized silicon and displaced legacy GPUs, while the megawatt holds its value. Whether it forms at all is what the full paper is built to answer.
The distinction to hold onto is scarcity rent versus stranded inventory. The full paper supplies the model to price the difference.
CONFIDENTIAL & PROPRIETARY - FOR RESEARCH PURPOSES ONLY · Teaser / Pre-Release
Figures: U.S. facilities only, single latest data vintage (14 Aug 2026), unit-level capacity. “Not cleared” = Vulcan status “none” (no satellite-observed land clearing) - SynMax Vulcan + IIR records. Pipeline scale: SemiAnalysis Datacenter Model (annual additions +21 GW in 2026 to +84 GW/yr by 2030; ~114 GW cumulative 2028 derived from that trajectory), Wood Mackenzie (~240 GW disclosed pipeline), Aurora Energy Research (~780 GW announced). Marketing teaser; not investment advice.