Headline SynMax models a +32 Bcf injection for the week ending August 7, roughly in line with the...
Weekly Storage and S/D Brief - week ending 8/14/2026
Week Ending August 14, 2026
SynMax Analytics | Published August 19, 2026
Headline
SynMax models a +15 Bcf injection for the week ending August 14 — a sharp deceleration from the prior week's EIA-reported +36 Bcf build and the smallest weekly injection of the summer. The slowdown is driven almost entirely by a surge in power burn, which jumped +2.37 Bcf/d WoW to 52.11 Bcf/d as the hottest stretch of the season pushed national population-weighted CDDs to 13.6 (their summer peak). Supply firmed only modestly — dry gas production edged up +0.50 Bcf/d to 111.70 Bcf/d — leaving demand growth of +3.41 Bcf/d to overwhelm the balance. If confirmed, working gas storage would stand at approximately 3,167 Bcf, roughly 30 Bcf below last year's pace and +196 Bcf (+6.6%) above the five-year average.
Review the full analysis on the dashboard
Storage Summary
The year-over-year position slips modestly on the light build: at ~3,167 Bcf the surplus-to-last-year narrows to a deficit of approximately 30 Bcf versus the ~3,197 Bcf level at the comparable 2025 week. Storage nonetheless remains comfortably above the five-year average of ~2,971 Bcf (+6.6%), preserving a healthy cushion heading into the final stretch of the injection season.
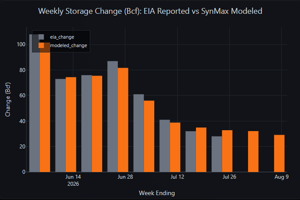
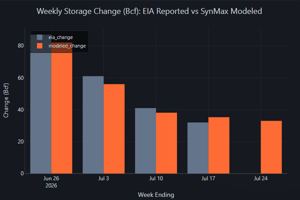
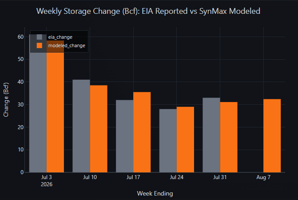
Model accuracy: Over the last five reported weeks, the SynMax model has averaged a mean absolute error (MAE) of 2.6 Bcf with a slight negative (under-injection) bias of -1.2 Bcf.
| Week Ending | EIA (Bcf) | Model (Bcf) | Error |
|---|---|---|---|
| Jul 10 | +41 | +37.2 | -3.8 |
| Jul 17 | +32 | +34.4 | +2.4 |
| Jul 24 | +28 | +29.3 | +1.3 |
| Jul 31 | +33 | +31.5 | -1.5 |
| Aug 07 | +36 | +31.8 | -4.2 |
Primary Driver: Power Burn Surge
The dominant feature of the week ending August 14 was a +2.37 Bcf/d week-over-week jump in electric power burn to 52.11 Bcf/d — the highest weekly average of the summer and a striking +8.16 Bcf/d above the year-ago level of 43.95 Bcf/d. This single sector accounts for essentially the entire tightening of the weekly balance.
The heat was regionally concentrated. The East region drove the increase, with power burn rising +1.54 Bcf/d WoW to 22.45 Bcf/d (+3.98 Bcf/d YoY), as the mid-August heat dome parked over the Mid-Atlantic and Northeast. The Midwest added +0.68 Bcf/d to 6.97 Bcf/d. The South Central (+0.11 to 14.56 Bcf/d), Mountain (+0.09 to 4.65 Bcf/d), and Pacific (-0.05 to 3.47 Bcf/d) regions were comparatively flat, having already been running hot the prior week.
On the supply side, dry gas production firmed +0.50 Bcf/d to 111.70 Bcf/d — still robust and running ~+3.8 Bcf/d above year-ago levels — but the increment was far too small to offset the demand surge. Canadian pipeline imports rose +0.13 Bcf/d to 8.61 Bcf/d, lifting total gross supply +0.63 Bcf/d to 120.31 Bcf/d. Against that, total demand climbed +3.41 Bcf/d to 119.61 Bcf/d, collapsing the daily surplus to 2.13 Bcf/d and the implied weekly injection to ~+15 Bcf.
Weather Context
National population-weighted CDDs averaged 13.6 for the week ending August 14, up from 12.6 the prior week and sharply above the year-ago 9.8 — the warmest week of the summer:
- August 8-10 delivered the peak heat, with daily CDDs of 14.2, 14.5, and 14.4 — the highest readings of the season
- August 11-14 eased gradually as the dome relaxed, with CDDs stepping down from 14.0 to 12.6
- Year-over-year, the +3.8 CDD gap (13.6 vs 9.8) maps directly onto the +8.16 Bcf/d YoY increase in power burn, underscoring how much of the demand strength is weather-driven rather than structural
Supply & Demand Factor Changes (WoW)
| Factor | WE 8/7 (Bcf/d) | WE 8/14 (Bcf/d) | Δ WoW | Impact |
|---|---|---|---|---|
| SUPPLY | ||||
| Dry Gas Production | 111.20 | 111.70 | +0.50 | Bearish |
| Canada Pipeline Imports | 8.48 | 8.61 | +0.13 | Bearish |
| Total Gross Supply | 119.68 | 120.31 | +0.63 | Bearish |
| DEMAND | ||||
| Electric Power | 49.74 | 52.11 | +2.37 | Bullish |
| Industrial | 22.04 | 21.99 | -0.05 | Neutral |
| Res/Com | 8.04 | 8.11 | +0.07 | Neutral |
| LNG Feedgas (exports) | 17.80 | 18.39 | +0.59 | Bullish |
| Mexico Pipeline Exports | 7.09 | 7.41 | +0.32 | Bullish |
| Canada Pipeline Exports | 3.05 | 3.03 | -0.02 | Neutral |
| Lease/Plant/Pipe/Vehicle | 8.46 | 8.58 | +0.12 | Neutral |
| Total Demand | 116.20 | 119.61 | +3.41 | Bullish |
| Balancing Factor | +1.11 | +1.43 | +0.32 | — |
| Implied Daily Surplus | 4.59 | 2.13 | -2.46 | |
| Weekly Injection (Bcf) | +32.1 | +14.9 | -17.2 |
Note: Canadian pipeline imports are treated as a supply source; Canadian pipeline exports are treated as demand (gas leaving the domestic market). The Balancing Factor captures the residual between independently modeled supply and demand components and is reported below the totals — it is folded into the implied change but excluded from Total Supply and Total Demand.
Secondary Factors
LNG Feedgas: Recovering to 18.39 Bcf/d
Total LNG feedgas averaged 18.39 Bcf/d for the week, up +0.59 Bcf/d from the prior week's 17.80 Bcf/d and approaching the summer high. The recovery reflects the easing of the Freeport softness seen in early August alongside sustained near-record throughput at Plaquemines. Higher feedgas is a bullish (tightening) factor for storage, removing roughly 4 Bcf of supply from the domestic balance over the week.
Mexico Exports: Higher
Pipeline exports to Mexico rose +0.32 Bcf/d to 7.41 Bcf/d, a bullish factor pulling additional gas off the domestic market — consistent with elevated cross-border cooling demand during the shared heat event.
Residential/Commercial & Industrial: Flat
Combined Res/Com demand was essentially unchanged at 8.11 Bcf/d (+0.07 WoW) — seasonal base load with no heating contribution. Industrial demand was likewise flat at 21.99 Bcf/d (-0.05 WoW). Neither sector was a factor in the weekly balance.
Regional Power Burn
| Region | WE 8/7 (Bcf/d) | WE 8/14 (Bcf/d) | Δ WoW | LY (Bcf/d) | YoY Δ |
|---|---|---|---|---|---|
| East | 20.92 | 22.45 | +1.54 | 18.48 | +3.98 |
| Midwest | 6.30 | 6.97 | +0.68 | 5.62 | +1.36 |
| South Central | 14.45 | 14.56 | +0.11 | 13.38 | +1.18 |
| Mountain | 4.55 | 4.65 | +0.09 | 3.94 | +0.71 |
| Pacific | 3.53 | 3.47 | -0.05 | 2.53 | +0.94 |
| CONUS | 49.75 | 52.11 | +2.36 | 43.95 | +8.16 |
The East region alone contributed nearly two-thirds of the week-over-week increase in national power burn, and every region ran well above year-ago levels — the +8.16 Bcf/d CONUS YoY gain is the clearest signal of how the mid-August heat wave dominated the week's demand.
Methodology & Data Sources
Storage change is modeled as Total Supply (Dry Gas Production + Canadian Pipeline Imports + LNG Imports) minus Total Demand (all consumption sectors + LNG feedgas exports + pipeline exports), with the Balancing Factor added as a calibration residual, multiplied by seven days. The EIA storage week runs Saturday through Friday (the week ending August 14 covers Saturday August 8 through Friday August 14). Canadian pipeline imports are treated as a supply source supplementing domestic production; Canadian pipeline exports are treated as demand. The Balancing Factor (+1.43 Bcf/d this week) represents the residual between independently modeled supply and demand components and calibrates the injection estimate against EIA actuals.
Data sources: SynMax daily production model (hdl.daily_production), SynMax demand model (hdl.gas_demand, baseline scenarios), SynMax LNG feedgas model (hdl.lng_feed_gas), EIA Weekly Natural Gas Storage Report, NOAA GFS/HRRR weather data (via local PostgreSQL temperature_conus).
Disclaimer: This report is produced by SynMax Analytics for informational purposes only. Modeled figures are estimates and may differ from official EIA releases. Past model accuracy does not guarantee future performance.