SynMax Research:
SynMax Research:
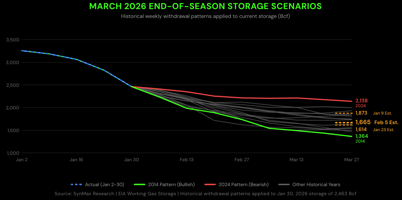
As we approach the calendar halfway point of the winter and the historical coldest days of the year later in January, the cone of possible end of season storage outcomes diminishes. Still the range remains wide. Utilizing the current 15-day Euro ensemble forecast, our end of January storage level is now projected at 2,632 Bcf with a current March 2026 projection of 1,873 bcf. This expectation still has a wide variance with the Euro ensemble forecasted weather changes this week adding over 40 bcf to storage. The influence of weather is increasingly important with one factor being the residential and commercial demand referenced in the recent SynMax research report.
Historical Comparisons and Market Implications
End-of-March storage levels typically have significant market pricing implications, making these projections a key fundamental factor for most market participants. Since 2010, the end-of-March EIA working gas storage level has varied from a low of 837 Bcf in 2014 to a high of 2,473 Bcf in 2012.
Applying historical weekly storage changes to current levels provides a look at the potential range:
- The 2014 Path (Bullish): Replicating 2014's weekly changes would see storage fall to 1,263 Bcf by the end of March 2026.
- The 2012 Path (Bearish): Replicating 2012's changes would leave storage at 2,215 Bcf.

Another approach involves examining previous monthly changes. On the bullish side - admittedly a low-probability scenario - if the maximum February and March withdrawals were matched (the 780 Bcf withdrawal from February 2021 combined with the 381 Bcf withdrawal from March 2013), March 2026 storage would drop to 1,471 Bcf. On the bearish side, combining the February 2024 withdrawal of 260 Bcf with the March 2025 injection of 49 Bcf would leave storage at 2,421 Bcf, near the record 2012 level. A more moderate approach examines the combined February/March change: the 2014 record withdrawal of 1,082 Bcf would result in 1,550 Bcf, while the record low withdrawal from 2024 would leave storage at 2,329 Bcf.


The Evolution of Fundamentals
Using historical storage data must be balanced with an appreciation of how fundamental factors have evolved. While temperature comparisons are straightforward, other variables have undergone structural shifts:
- Production: In early 2014, production averaged 67.62 Bcf/d. Driven by the shale revolution, our current February/March 2026 estimate stands at 108.35 Bcf/d.
- Power Burn: 2012 and 2014 saw power burn levels near 20 Bcf/d. While coal-to-gas switching was a major factor then due to higher coal capacity, the grid has fundamentally shifted. Our projected 2026 February/March average power burn is 31.6 Bcf/d, reflecting permanent coal retirements and new load growth.
- LNG Exports: This pillar of demand did not exist in 2012 or 2014. With eight operating facilities and a ninth expected to commission in early 2026, our export estimate stands at 19.06 Bcf/d.

Sensitivity to Temperature Deviations
Given the volatility of late-winter weather, we consider deviations from the 10-year rolling average:
|
Temperature Deviation |
Projected March 2026 Storage |
|
+2° Normal |
2,114 Bcf |
|
+1° Normal |
2,006 Bcf |
|
10-Year Normal |
Base Forecast |
|
-1° Normal |
1,767 Bcf |
|
-2° Normal |
1,647 Bcf |
For context, February and March experience standard deviations of 2.87°F and 2.18°F, respectively. Thus, deviations of one or two degrees are considered modest and highly possible.
Conclusion
While recent market action reflects the moderation in this week's temperature forecasts, the end-of-season storage range remains expansive. The interplay between record production, structural demand growth in the power sector, and the expansion of LNG capacity creates a unique backdrop for price paths as we exit the winter season.
We’re focused on continuing to improve our products and services — and your feedback plays a big role in that. We’d really appreciate it if you could take a few minutes to complete a short survey and share your thoughts with us.