
This month's update is a quiet one. We have refreshed our regressions against the latest...
As announced in our latest webinar, we are moving to a monthly cadence for our daily production model updates. This change ensures our models stay fresh as pipeline infrastructure across the Lower 48 continues to evolve. Overall, the changes in this update are minimal — revisions in Ohio are largely counteracted by upward revisions in Haynesville Louisiana and South Texas. These changes will be live in the morning of 23 Apr 26.
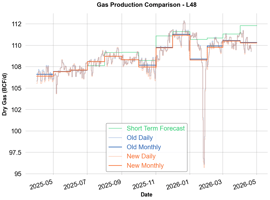
L48 Changes
Our L48 production estimate has been revised downward by an average of 0.07 Bcf/d since July 2025, while the current-day estimate has increased by 0.08 Bcf/d. The net effect at the L48 level is small, as offsetting revisions across subregions largely cancel out.

Notable Sub Region Changes
Ohio
Ohio reports its production on a quarterly basis. We have improved our allocation of production across the months within each quarter to produce a more accurate model. As a result, our Ohio production estimates have been revised downward by an average of 0.28 Bcf/d since July 2025. The updated STF will be live at the same time as this change.

Haynesville LA
Haynesville LA has been revised upward by an average of 0.15 Bcf/d, driven entirely by state-published revisions to historical production data — with upward revisions of as much as 0.3 Bcf/d going back to January 2024.

South Texas
South Texas has been revised upward by an average of 0.12 Bcf/d, reflecting upward revisions in state-reported production.

As usual, if you have any questions, please reach out to support@synmax.com.
Appendix: Updated Alignment Dates
When fitting our daily production estimates, we consider two key dates for each subregion:
- State alignment cutoff: the date up to which we align our daily production estimates to state-reported production. On this day and prior the daily production model monthly averages are guaranteed to match state data.
- Last fitted date (or "last good" date): the date up to which we regress against the state data. The last fitted date can sometimes extend beyond the state alignment cutoff — this occurs when we are modeling reporting delays and therefore fitting against our own version of the state data (as discussed here).
The current alignment dates by subregion are shown below:
| Sub Region | Last Fitted Date | State Alignment Cutoff |
| Wyoming | 01 Dec 25 | 01 Dec 25 |
| WV | 01 Dec 24 | 01 Dec 24 |
| West - TX | 01 Dec 25 | 01 Dec 24 |
| SW PA | 01 Feb 26 | 01 Feb 26 |
| South - TX | 01 Jun 25 | 01 May 25 |
| S LA | 01 Oct 25 | 01 Oct 25 |
| SanJuan-CO | 01 Oct 25 | 01 Oct 25 |
| Permian-NM | 01 Jan 26 | 01 Jan 26 |
| OK | 01 Jan 26 | 01 Jan 26 |
| OH | 01 Dec 25 | 01 Nov 24 |
| North - TX | 01 Dec 25 | 01 Jun 25 |
| North Dakota | 01 Feb 26 | 01 Feb 26 |
| N LA | 01 Oct 25 | 01 Oct 25 |
| NewMexico | 01 Jan 26 | 01 Jan 26 |
| NE PA | 01 Feb 26 | 01 Feb 26 |
| MS | 01 Dec 25 | 01 Nov 25 |
| MI | 01 Nov 22 | 01 Nov 22 |
| KS | 01 Sep 25 | 01 Sep 25 |
| Haynesville - TX | 01 Aug 25 | 01 May 25 |
| Haynesville - LA | 01 Aug 25 | 01 Sep 24 |
| GOM | 01 Jun 25 | 01 Jun 25 |
| Colorado wo SJ | 01 Oct 25 | 01 Oct 25 |
| Central - TX | 01 Sep 25 | 01 Apr 25 |
| AR | 01 Dec 25 | 01 Dec 25 |
| AL | 01 Oct 22 | 01 Oct 22 |

