Introduction
Last week, we announced a significant enhancement to our natural gas production forecasting methodology—a new three-facet hybrid approach that delivers more accurate daily production estimates across major producing regions. As we mentioned, due to the nature of the changes, it was essentially impossible to get a perfect before/after comparison, though the numbers and charts we presented were very close, we wanted to follow-up with the exact before/after. As expected, they were very close.
In this post, we'll walk through comparative charts showing how our new model differs from the previous approach, focusing on the areas with the largest changes.
Methodology Recap
Our enhanced framework addresses three key challenges in production forecasting:
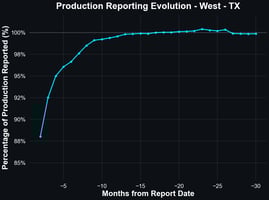
- Report Rate Correction adjusts for the fact that Texas production data starts incomplete and gets revised upward for 12-18 months, giving us more accurate training data.
- County-Level Lasso Regression uses machine learning to automatically identify which counties have reliable / correlated pipeline coverage and weight them appropriately.
- Hybrid STF Coverage fills pipe scrape coverage gaps by substituting short-term forecasts for counties with no interstate pipeline visibility.
Together, these techniques produce materially different estimates in several key regions—differences that better reflect underlying production reality. You can read a detailed explanation of the model changes in our white paper. Let's examine the specific impacts.
L48
Across the Lower 48, production has been revised upwards by approximately 1 Bcf/d from July through October 2025, before converging with the old model in the most recent month. These changes are largely concentrated in South and West Texas, where the new methodology's improvements are most pronounced. Note that January and February were revised downwards by approximately 0.5 Bcf/d due to updated state data incorporated into the model.


Subregion Changes
The following subregions show monthly averaged production changes exceeding 0.2 Bcf/d:
West Texas
West Texas has been revised upwards by approximately 0.4 Bcf/d since June 2025. The changes primarily stem from our report rate correction applied to state data. By correcting for the historical reporting lag patterns in this subregion—where production numbers continue being revised upward for 12-18 months—we now regress on a more accurate representation of actual production (see our methodology post for details on the report rate model).

South Texas
South Texas has been revised upwards by approximately 0.3 Bcf/d since April 2025. This region benefits from all three facets of the new methodology:
- Report rate correction: A moderate upward revision to account for historical reporting lags (less dramatic than West Texas but still significant)
- Hybrid STF coverage: Production coming online in counties without interstate pipeline visibility is now captured. For example, DeWitt County production is up approximately 0.1 Bcf/d year-over-year, but state-reported changes in this county don't appear in interstate pipeline measurements. We therefore substitute our short-term forecast for this county, which we believe more accurately reflects current production levels.
- County-level regression: Our Lasso regression has identified that interstate pipeline measurements from counties such as Bee, Jackson, and Jim Hogg are significantly more indicative of total subregional production than measurements from other counties in the area, leading to an improved regression fit to the corrected state data. That said, interstate pipeline coverage in South Texas remains fundamentally poor — capturing only a fraction of total production. While the new methodology is a meaningful improvement, South Texas estimates still carry substantially more uncertainty than better-monitored regions.

Northeast Pennsylvania
Northeast Pennsylvania has been revised downwards by approximately 0.3 Bcf/d since May 2025. While our backtesting showed that the new county-level regression model provides better predictive accuracy for this region, the current production changes actually stem from updated state data that extends our last reliable data point forward to August 2025. We expect the improved regression to deliver more accurate estimates going forward as new data arrives.

Ohio
Ohio production estimates have increased steadily relative to the old model starting in June 2025, peaking at +0.2 Bcf/d in October. Ohio continues using the total pipe flow regression model (our previous approach) with updated coefficients based on the latest state data. We tested the county-level regression model for this region but did not observe a significant improvement in fit, so we opted to maintain the simpler, well-performing approach.

Haynesville Louisiana
Haynesville Louisiana has been revised downwards by approximately 0.3 Bcf/d from September 2025. These changes stem entirely from updated state production data incorporated into both the old and new models. The region continues using the total pipeline flow regression model with updated coefficients based on the latest state data.

Oklahoma
Oklahoma production has been revised downwards by approximately 0.35 Bcf/d at the start of 2025. Like Haynesville Louisiana, these changes are driven by updated state production data rather than methodological improvements. Oklahoma continues using the total pipeline flow regression approach with refreshed parameters.

Southwest Pennsylvania
Southwest Pennsylvania has been revised upwards by approximately 0.2 Bcf/d since July 2025. This region is now using our county-level regression model, which showed a dramatic improvement in fit to state data—increasing the R² from 0.1 to 0.7. This substantial improvement in accuracy suggests the new model is much better at capturing the relationship between pipeline flows and total production in this region, which should translate to more reliable production estimates going forward.

As usual, if you have any questions, please contact us at support@synmax.com
Appendix
The table below shows subregions that use at least one of the three methodology enhancements. All other subregions use a simpler regression model based on total pipeline measurements, with updated coefficients using the latest state-reported production data.
| Subregion | County level regression | STF replacement for insensitive counties | Report rate correction applied |
| AL | ✔️ | ||
| Central - TX | ✔️ | ||
| Haynesville - TX | ✔️ | ✔️ | |
| KS | ✔️ | ||
| NE PA | ✔️ | ||
| N LA | ✔️ | ||
| North - TX | ✔️ | ||
| South - TX | ✔️ | ✔️ | ✔️ |
| SW PA | ✔️ | ||
| West - TX | ✔️ | ✔️ | ✔️ |
-1.jpg?height=200&name=Email%20blast%20title%20template%20(1)-1.jpg)