Vulcan Platform Update | April 2026
The grid and the data centers behind the AI boom are being built faster than the official data can track it. EIA metadata lags. Developer timelines slip. And policy friction — moratoriums, denials, pauses — is quietly rewriting where and when megawatts actually land. If you’re allocating capital or setting strategy off self-reported numbers, you’re seeing the buildout months late.
Vulcan closes that gap. We turn satellite imagery into weekly, ground-truth intelligence on what is actually under construction across U.S. power and data centers. And when you have a question we haven’t answered yet, we build the dashboard — often within a day.
Here are three updates we shipped this month. Every one of them started as a question from a client or a prospect.
1. Everyone expected batteries to slow down.
A client outside the data-center world asked a straightforward question: what are the real construction trends in power generation? So we built a new dashboard, live on the platform, that breaks generation under construction down by technology and by ISO.
The surprise: despite a rough year for battery-dispatch economics in ERCOT, batteries under construction are holding strong. Falling battery costs and tight coupling with solar are keeping the pipeline full. Pick a technology, pick an ISO, and watch the trend for yourself.
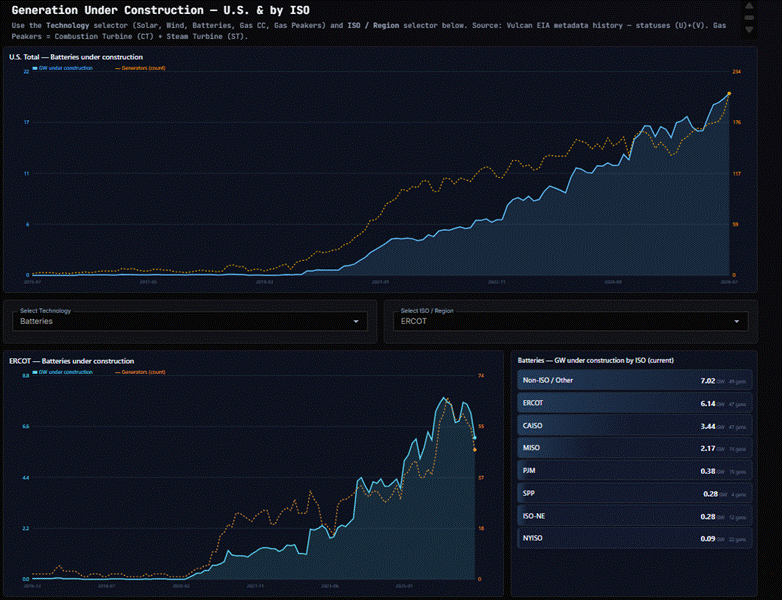
Generation under construction, by technology and ISO — live in the Vulcan platform.
2. The data-center land-clearing slowdown — now broken down by region and ISO.
On a Jefferies webinar on 9/23/26, the question came up: where is the slowdown in land clearing actually happening? Within a day, every Vulcan client had the answer — land-clearing run-rates by region and by ISO, compared across 12-month, 3-month, and 1-month windows so you can see how fast the trend is turning. It updates daily at the bottom of the Data Center Key Milestone Dashboard.
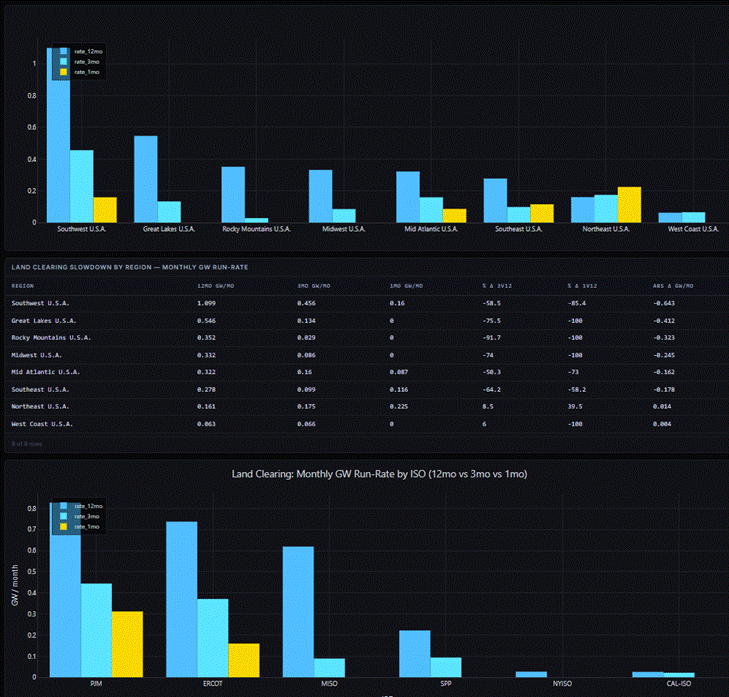
Land-clearing run-rate by region and ISO, across 12-, 3-, and 1-month windows.
3. How much is policy friction actually slowing construction?
Then we answered the harder question: what does all the friction — the policy and community pushback on data centers — actually do to construction? The Datacenter Friction Dashboard shows it.
Accumulated friction has stalled new land clearing over the past few months. But there’s a flip side worth seeing: projects on already-cleared land are accelerating, because capital and crews are being redeployed from paused developments to active ones. Log in, open the Datacenter Friction Dashboard, and see the full picture.
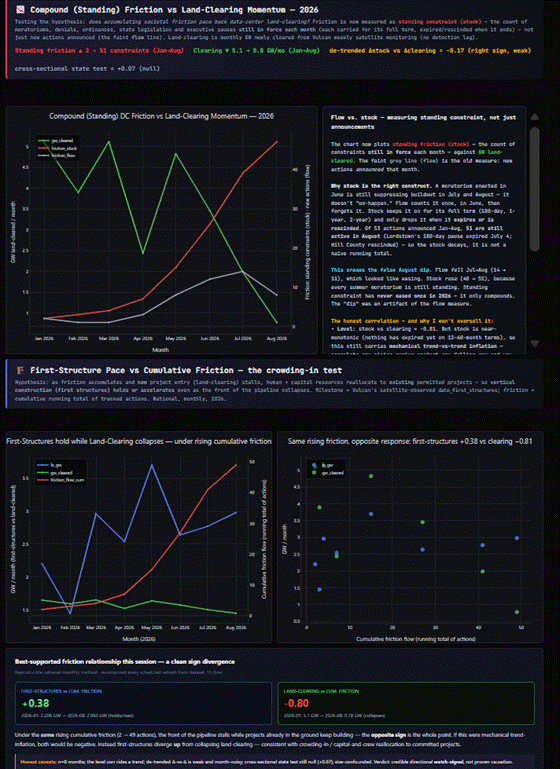
Standing friction vs. land-clearing momentum — the Datacenter Friction Dashboard.
That’s the pattern: you bring the question, we build the answer.
Satellite-verified. Updated weekly. Usually turned around within a day of you asking. That’s what it looks like to stop guessing from data that’s already months old — and to know where power and data centers are really getting built before the market does.
Book a 30-minute demo.
We’ll show you the live dashboards built around your questions — and answer one of yours on the call. Contact David Bellman at dbellman@synmax.com.