.png?height=200&name=image%20(11).png)
SynMax Research:
SynMax Research:
A Historic Month for U.S. Power Capacity Additions
What You'll Know After Reading This
The EIA-860M just posted its largest single-month capacity addition since 2015. This briefing tells you what was added, what was canceled, what's hiding in the data and why Vulcan's satellite-verified rankings are the only reliable way to separate real construction from paper projects.
The Headline: A Record-Breaking Month
This is a historic EIA-860M update.
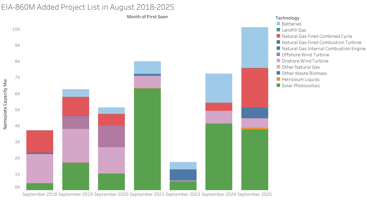
38.5 GW of new capacity was added in a single monthly cycle, the most since at least 2015. Of that, 17 GW is natural gas, a signal of continued commitment to dispatchable generation as the grid navigates the energy transition.

Narrowing to projects expected online by end of 2030, the picture sharpens:
- ~34 GW total capacity expected online by 2030
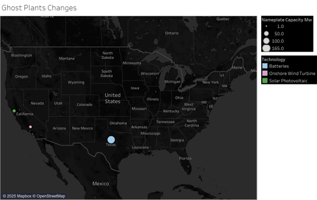
- ~15 GW of that is in Texas alone
Texas continues to dominate the near-term build pipeline. These are not distant aspirations, they are planned projects that operators and grid planners need to track with precision.

The Problem: Most of These Projects Won't Get Built
Here's what the raw EIA data won't tell you: 80% of the projects being added to Vulcan's power under-construction tracker show no construction activity on the ground.
The EIA-860M reflects what developers plan and permit, not what they actually build. Without satellite verification, analysts face a familiar trap: mistaking a crowded pipeline for a crowded construction site.
That gap is where Vulcan earns its value. SynMax will be adding 200+ projects to the Vulcan Power under-construction tracker over the coming weeks. Each will carry a satellite-verified construction status and a final_rank score (0–7 scale) indicating actual likelihood of completion. For 80% of new entrants, that rank will be low. No dirt has moved.
If you're making capacity forecasts, procurement decisions, or investment calls based on EIA filings alone, you're working with noise. Vulcan filters that noise.

What Was Canceled: 2.4 GW Exits the Pipeline
This month also saw 2.4 GW of projects canceled, with solar accounting for nearly all of it at 2.3 GW.
This is not surprising. The canceled solar projects were disproportionately low-ranked. Most carried a Vulcan final_rank below 3, indicating minimal construction activity had ever been detected. Vulcan users would have flagged these projects as low-probability well before the official cancellation appeared in the EIA data.
This is the early-warning function Vulcan is built to deliver.

The Catch-Up: 1.6 GW Appearing in Operations for the First Time
A less obvious but meaningful signal this month: 1.6 GW of capacity appeared in the EIA-860M operational dataset for the first time; projects that came online but weren't captured in prior monthly filings.
- 1.2 GW of that has been operational since 2025
- 1.2 GW is solar
This represents a data-lag issue in the EIA reporting pipeline. Projects complete, begin generating, and only later surface in the 860M. For analysts relying solely on EIA data, these plants were effectively invisible until now. Vulcan's satellite construction timeline would have shown completion activity months earlier if tracked.

What This Means for You
|
Signal |
EIA-860M Alone |
With Vulcan |
|
New projects added |
✅ Visible |
✅ Visible |
|
Construction actually started |
❌ Delayed |
✅ Satellite-verified |
|
Project likely to complete |
❌ Unknown |
✅ Ranked 0–7 |
|
Cancellation risk |
❌ Unknown |
✅ Early warning via low rank |
|
Plants already online but unreported |
❌ Delayed |
✅ Detected at completion |
|
Risk of Delayed |
❌ Unknown |
✅ Weekly Progress Indicator |
SynMax Vulcan monitors U.S. power, datacenter, and LNG projects using satellite imagery to independently verify construction status and predict online dates, separate from official EIA estimates.
For API access or questions about this analysis, contact the SynMax research team.