Prepared from SynMax storage-call tracking, Hyperion S/D and storage balances, EIA-930 generation, and GFS weather. Figures refresh each Monday.
Last Week Recap
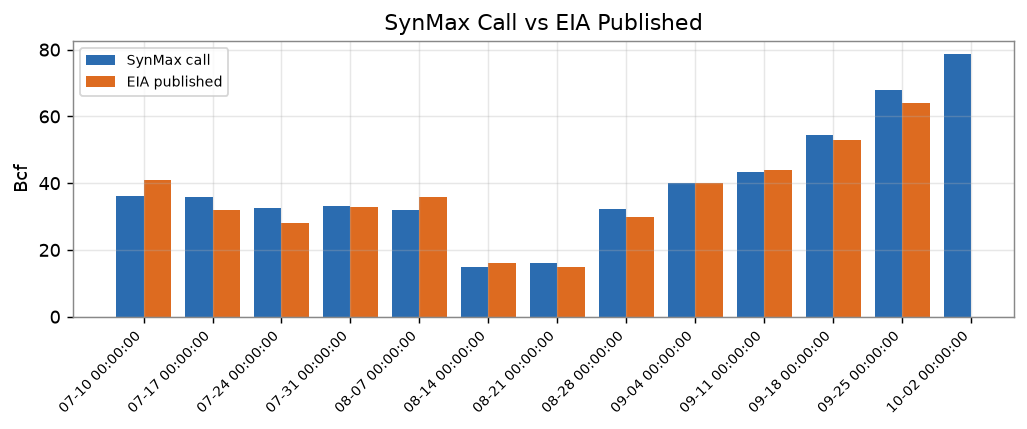
The EIA reported a +64 Bcf injection for the week ending September 25, 2026. SynMax called +68 Bcf, a modest over-call of +4.0 Bcf, inside the normal weekly band.
Seasonal scorecard: Since July 3, the model's mean absolute error is 2.6 Bcf with a bias of just +0.1 Bcf, essentially unbiased. Accuracy has tightened recently with the last 8 weeks running at 1.9 Bcf MAE / +0.2 Bcf bias. Every weekly call since early July has been within 5 Bcf of the EIA, with the largest miss just −4.8 Bcf (week ending July 10).
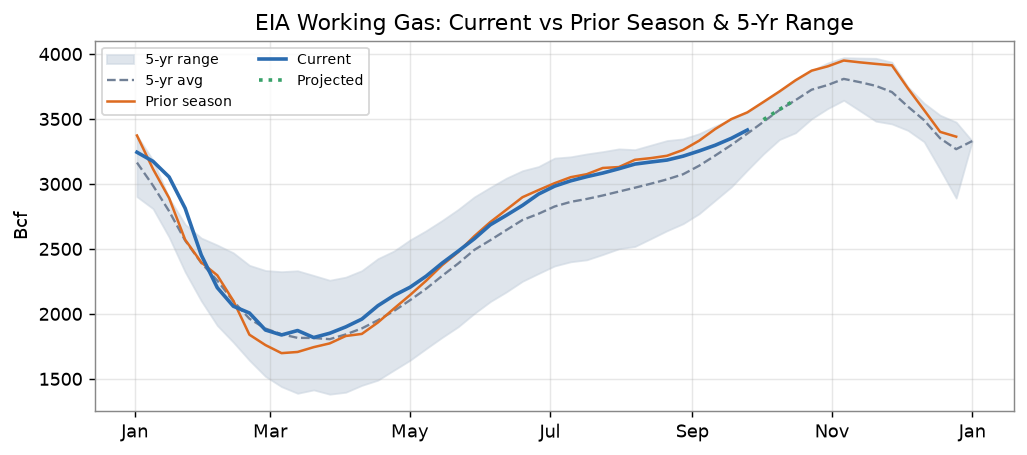
Working gas inventories now stand at 3,415 Bcf as of 9/25, 27 Bcf above the 5-year average but 136 Bcf below last year. Looking ahead, the next three storage weeks are currently modeled at 79, 78, and 80 Bcf, which would put inventories at 3,653 Bcf on Oct 16.
Week ending October 2
Current SynMax call: +79 Bcf, lifting inventories to 3,494 Bcf.
Week-over-week drivers (Oct 2 vs Sep 25):
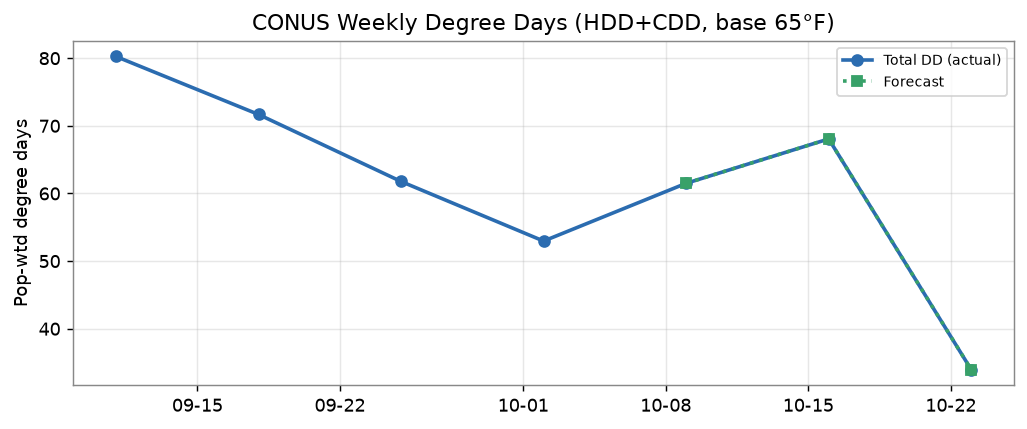
- Weather: CONUS total population-weighted degree days (HDD+CDD, base 65°F) eased from 62 to 53 (−9) as a shoulder-season cooldown trimmed cooling load. Softer weather load is the primary driver for the increased injection.
- Supply/demand: Electric-power burn dropped 2.1 Bcf/d on the cooler pattern and was partially offset by easing dry-gas production, which was down 0.8 Bcf/d on the week. All other components were essentially flat.
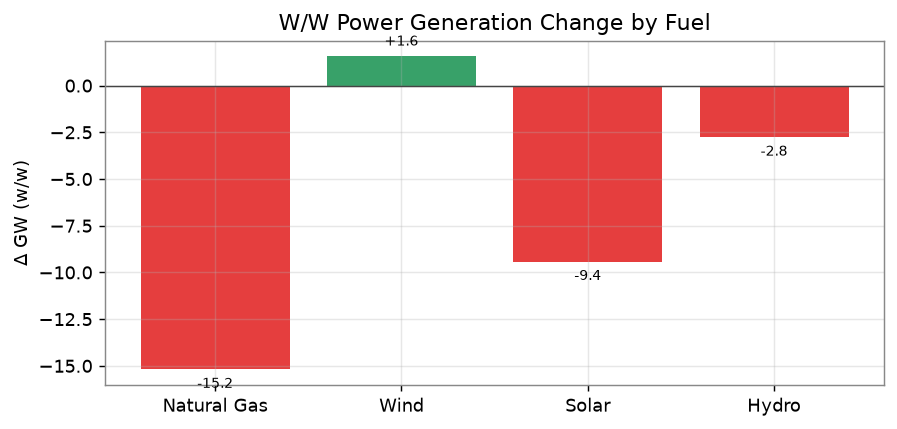
- Renewable generation (EIA-930, US48): Wind generation rose +1.6 GW week on week while solar fell −9.4 GW as daylight shortened; on net, renewable output declined, a modest tailwind to gas burn. Gas-fired generation itself fell ~15 GW, but that is the end-of-summer cooling collapse, not renewable displacement.
LNG
Total U.S. LNG feedgas was essentially flat week-over-week at ~18.7 Bcf/d with no unplanned outages, although there were minor disruptions at multiple facilities.
The one active maintenance item is Cove Point's annual turnaround (Sep 20 – Oct 11). That 0.8 Bcf/d of lost export demand has been off the market across the recent prints, and the facility is expected back around Oct 11. Freeport's August turnaround (two trains, ~40% utilization) is complete and the plant is back to full rate.
Pipeline Events
Fall-maintenance season is active but mostly regional. The notable discrete event is a Texas Eastern (TETCO) Force Majeure on Line 15 (Tompkinsville and Danville compressor stations, Valve Sections 2–4), posted Oct 2 and still in effect, with Force Majeure terms extending toward year-end.
A short-lived Columbia Gas (TCO) Force Majeure on the MXP/Mountaineer Xpress Line-100 in West Virginia (Saunders Creek leak) cut the MXPSEG constraint to zero (~1.8 MMDth/d of firm impact) from Sep 24 before being lifted for Gas Day Sep 28.
The remainder of the "critical" traffic is routine daily western-system capacity constraints (Northern Natural, Transwestern, El Paso Natural Gas) plus scattered low-level OFOs — noisy at the point level but not materially moving the national balance this week.
Long-Term Storage Outlook
End-of-season baseline levels and modeled peaks/troughs:
| Season endpoint | Baseline level | Modeled peak / trough |
|---|---|---|
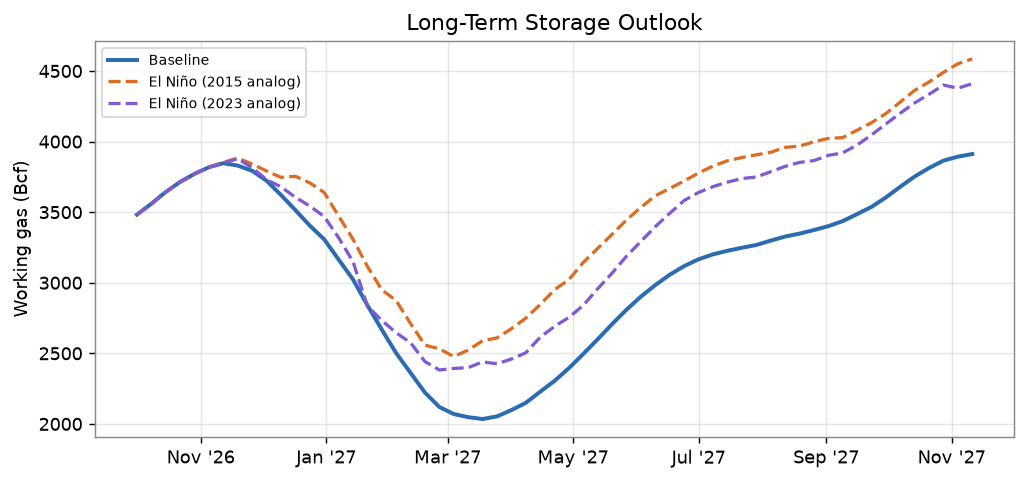
| End-injection Oct 31, 2026 | 3,790 Bcf | peak 3,847 Bcf @ Nov 11, 2026 |
| End-withdrawal Mar 31, 2027 | 2,094 Bcf | trough 2,035 Bcf @ Mar 18, 2027 |
| End-injection Oct 31, 2027 | 3,884 Bcf | still building past month-end (see note) |
SynMax's Baseline storage scenario assumes the short term GEFS forecast followed by the average demand across the ten most recent weather years. This is deliberately not demand at "average weather": demand responds quite nonlinearly with respect to temperature, and averaging the demand outcomes preserves the weight of cold snaps and heat waves that a smoothed temperature profile would wash out.
As many weather forecasters are calling for an El Nino winter, the chart below also shows our projected storage outlook under the two most recent El Nino winter weather paths through March. Under those paths the end-withdrawal carryout on Mar 31, 2027 lands near 2,665 Bcf (2015 analog) and 2,451 Bcf (2023 analog), well above the Baseline trough. Beginning in April, those paths utilize the Baseline demand scenario and thus the storage outlooks run in parallel with the Baseline through summer 2027. Refer to the Long-Term Storage Outlook dashboard for other weather paths.
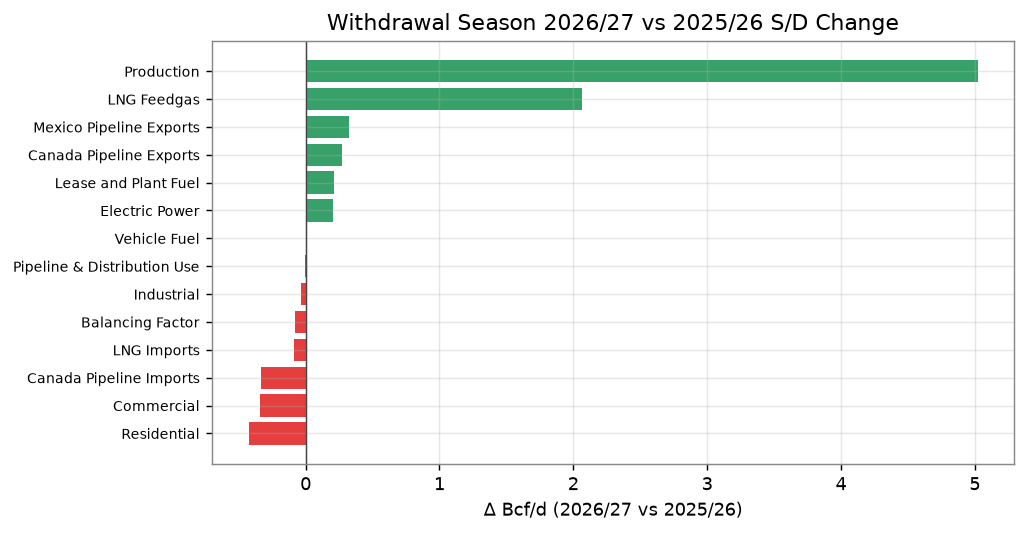
Year-over-year S/D for the withdrawal season (Nov–Mar 2026/27 vs 2025/26): supply growth is set to outpace demand through the heating season, which supports the higher projected carryout and the shallower modeled trough. Averaged across November–March, dry-gas production is +5.0 Bcf/d year-over-year and only partly offset by increased LNG feedgas (+2.1 Bcf/d) driven by Plaquemines and Corpus Christi. Core heating demand is little changed to slightly softer: residential and commercial each ease ~0.3–0.4 Bcf/d, electric power firms ~0.2 Bcf/d, Mexico exports add ~0.3 Bcf/d, and Canadian imports slip ~0.3 Bcf/d. Net, the implied daily balance loosens by roughly 2.3 Bcf/d this winter vs last.