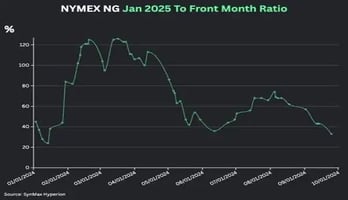
Although natural gas prices have decreased significantly over the past month, we believe the...
South Texas Daily Production Variability
|
We recently noticed that the day-to-day variance of South TX daily pipe model is much smaller than similar periods in history: In examining the data, we discovered two problems, one of which we are fixing today, but both stemming from the same root cause: The STX pipe scrape sample is small relative to overall production in the region. This has led to two problems:
Today we are fixing problem one. Starting tomorrow, you will see the green line below for historic production (production before our last good date from the state, at this point September 2024) . Note that this does NOT change the overall average monthly production from the region - we are merely changing the day-to-day variation. As you can see, this still shows our current pipe scrape could be understating volatility, we are assessing this now and will update you if we make further changes. As always, please reach out to us (support@synmax.com) if you have any questions. |

