
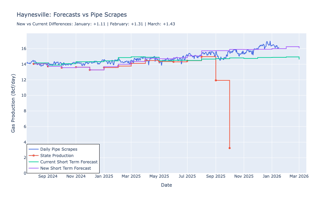
We have noticed problematic performance of the Haynesville LA Short Term Forecast (STF) due to very...
As we normally do, we have been monitoring our production model, the state production data and their relationship to the Short Term Forecast, and based on those reviews, we have decided to update five subregions - Permian NM, West - TX, NE PA, SW PA, and WV. These changes will be live as of 17 Feb.
Why Are We Doing This Now?
One of the primary motivators for this change was finally accumulating enough state production history for areas with key new pipelines - Matterhorn and Mountain Valley Pipeline (MVP) - to allow us to calibrate (in the case of Matterhorn) or more-accurately calibrate (in the case of MVP) our model to history. In the case of Matterhorn, specifically, we were adding all of the volume to one subregion presuming the production was incremental, and this has allowed us to move it into the sample and properly calibrate to state production history. In the case of NE PA, we are only updating for consistency, since we have updated the last good data we are using in SW PA, we felt it was necessary to update NE PA.
What Changed?
In every case, there are historical daily production estimate changes as well as current changes, as we have updated our state data as well as updated our modelling. For almost all of these, the historical changes were of similar magnitude and direction as the current day, so the overall picture of production down from recent peaks is consistent, just at a higher level. (The only exception is WTX - where the revisions have us testing new highs.)
Please note the greatly varying scale for these various graphs.
Specifically, for West-TX: +1.4 bcf/d currently: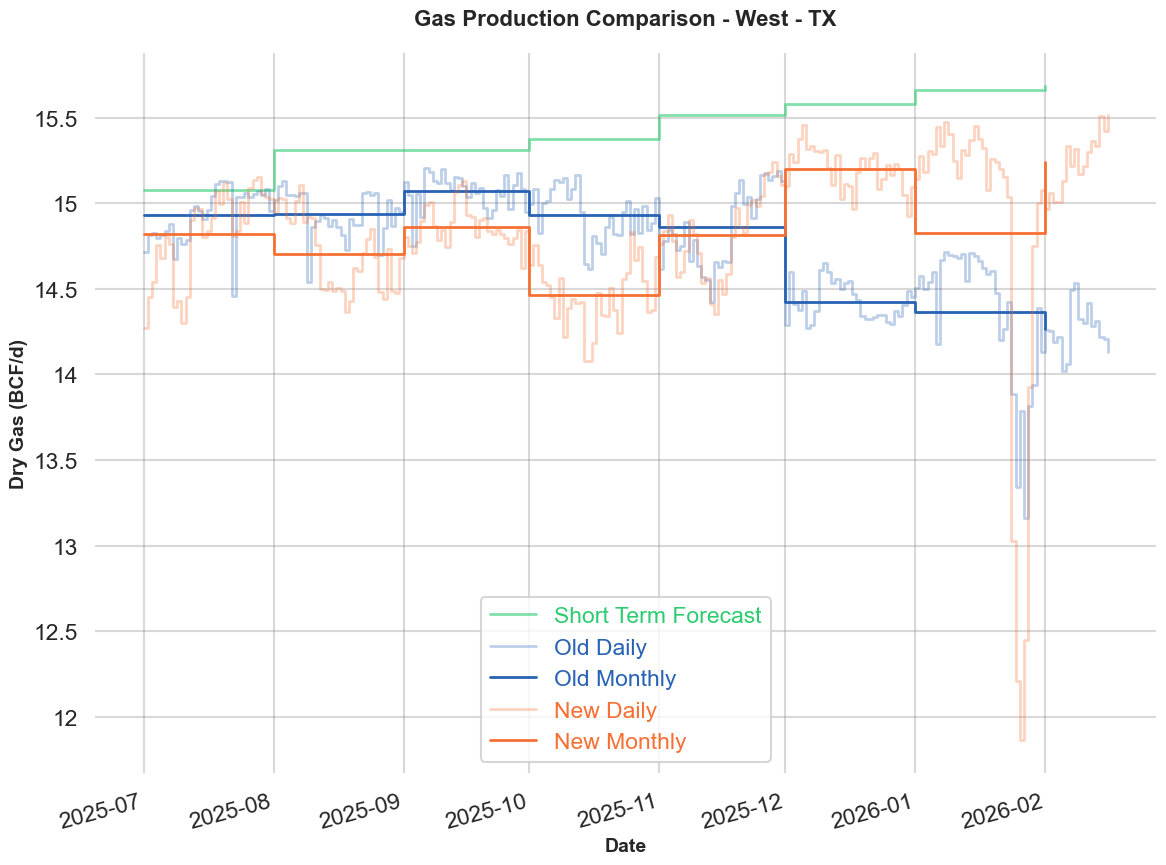
Permian NM: flat currently: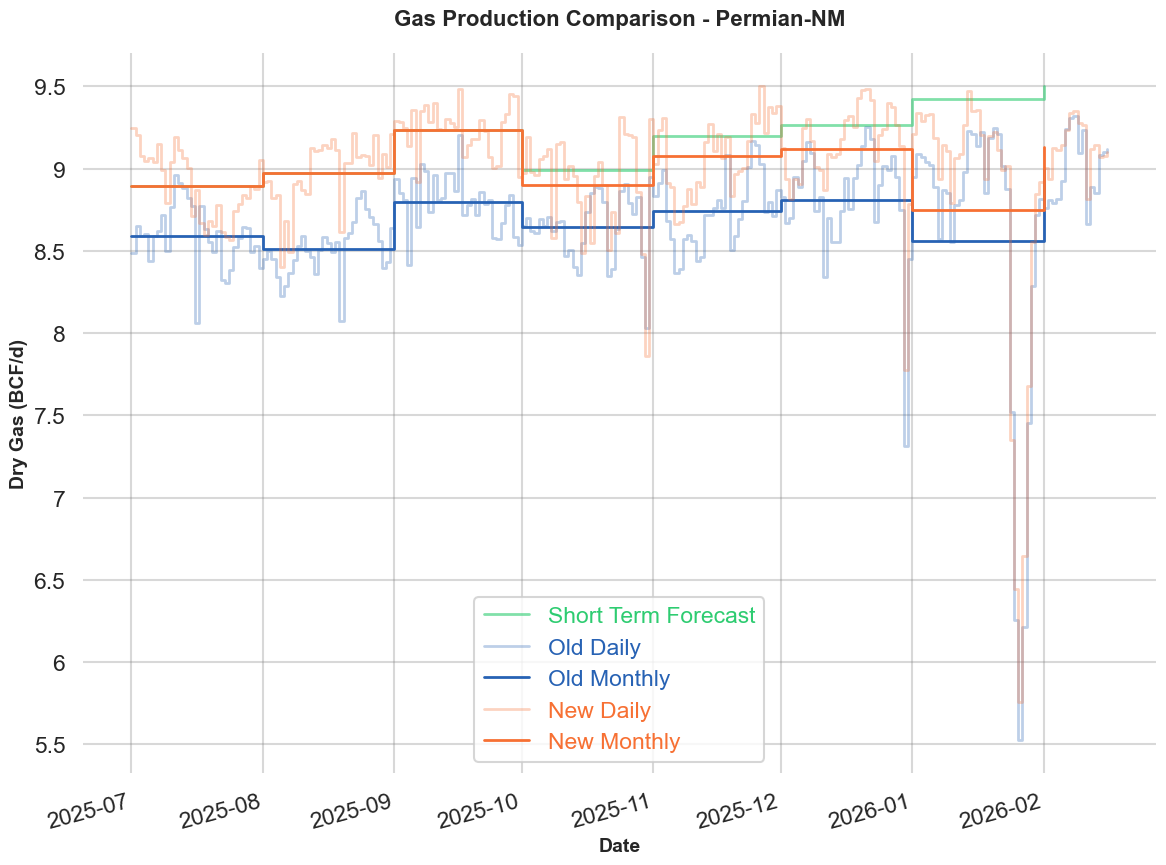
Total Permian: +1.4 bcf/d currently: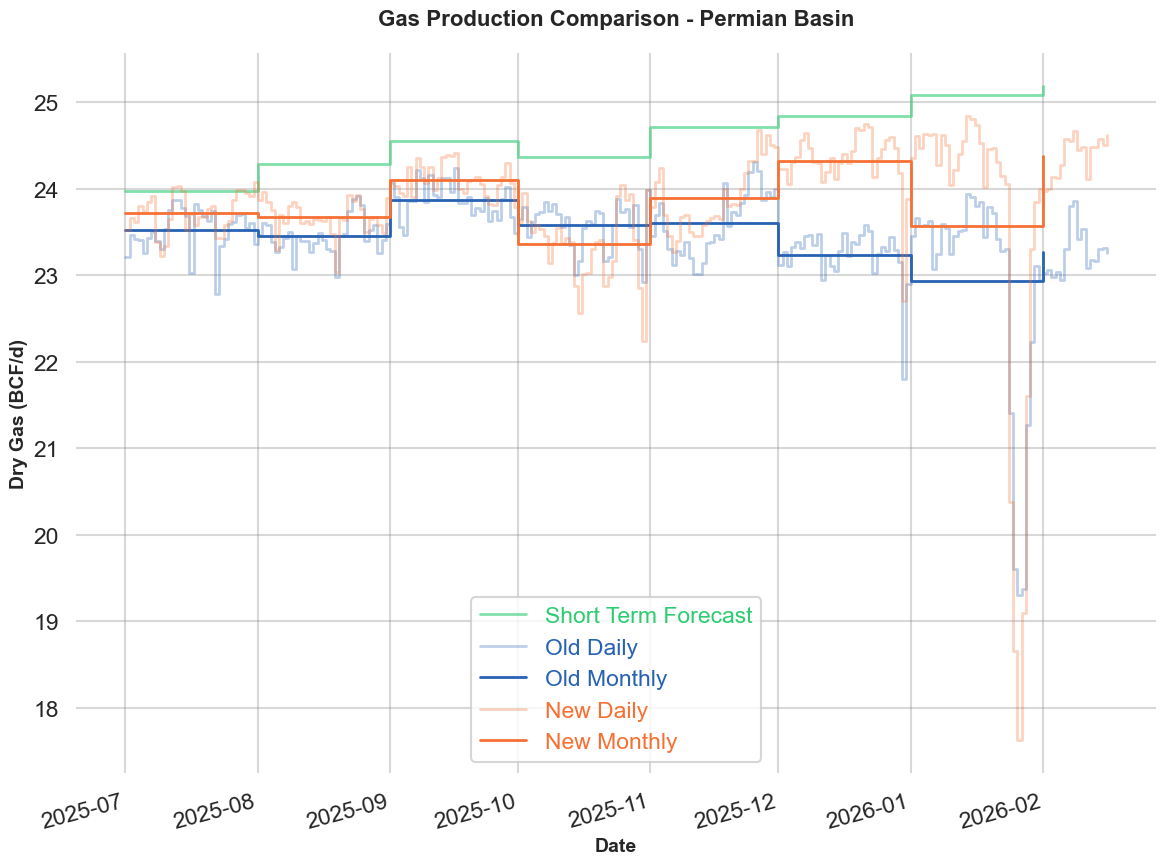
NE PA: +0.3 bcf/d currently: 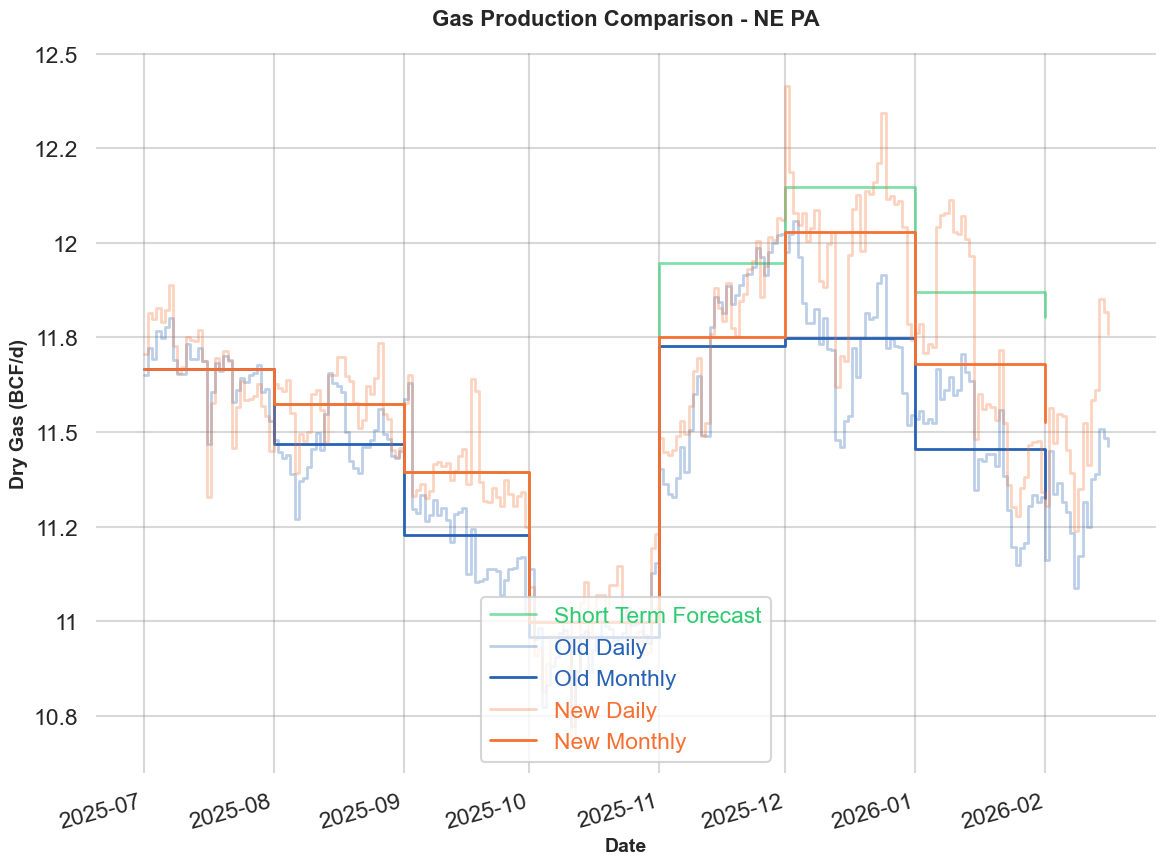
SW PA: +0.2 bcf/d currently: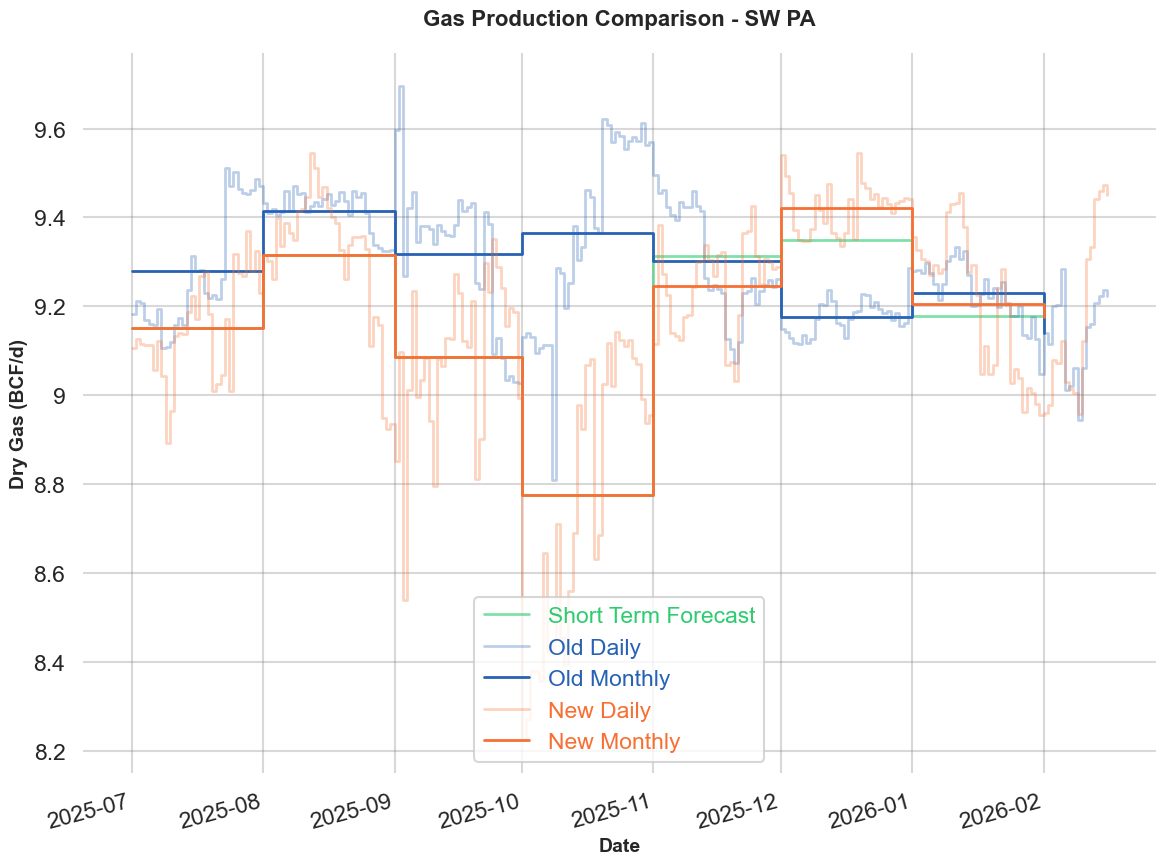
WV: + 0.2 bcf/d currently: 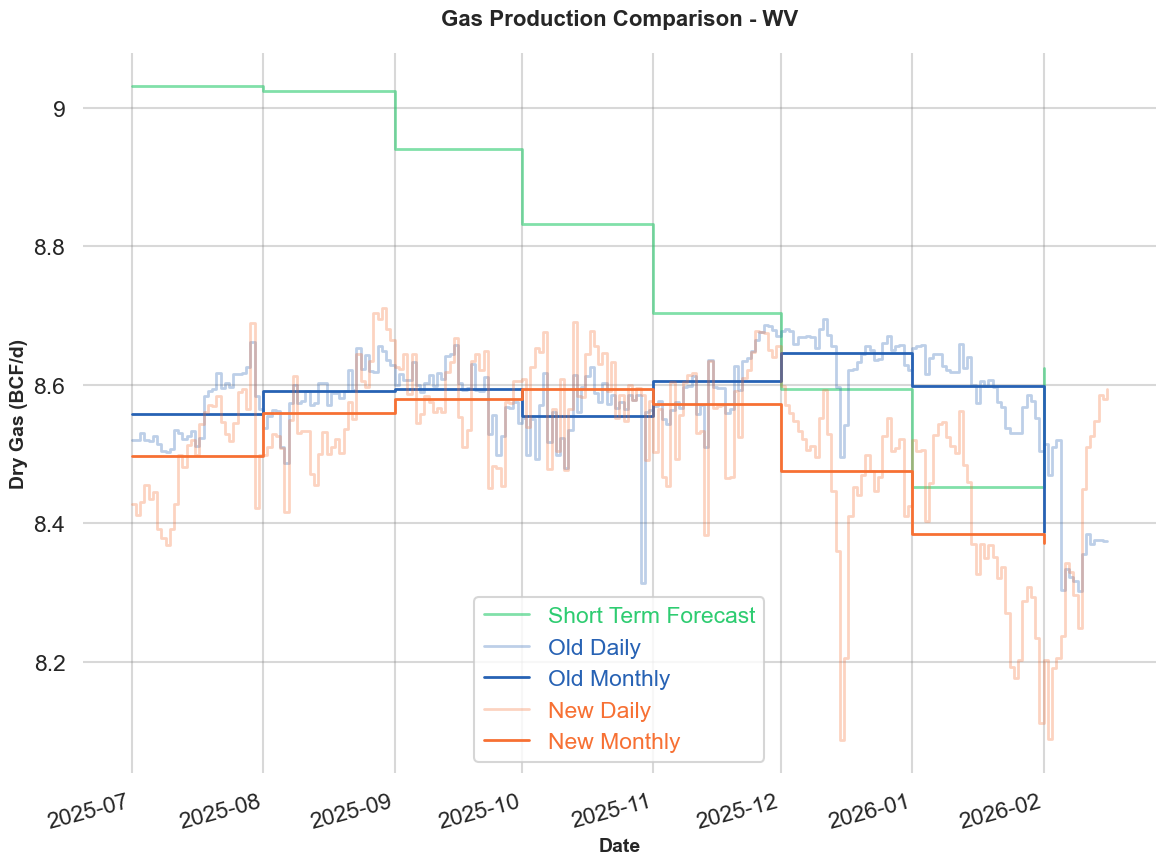
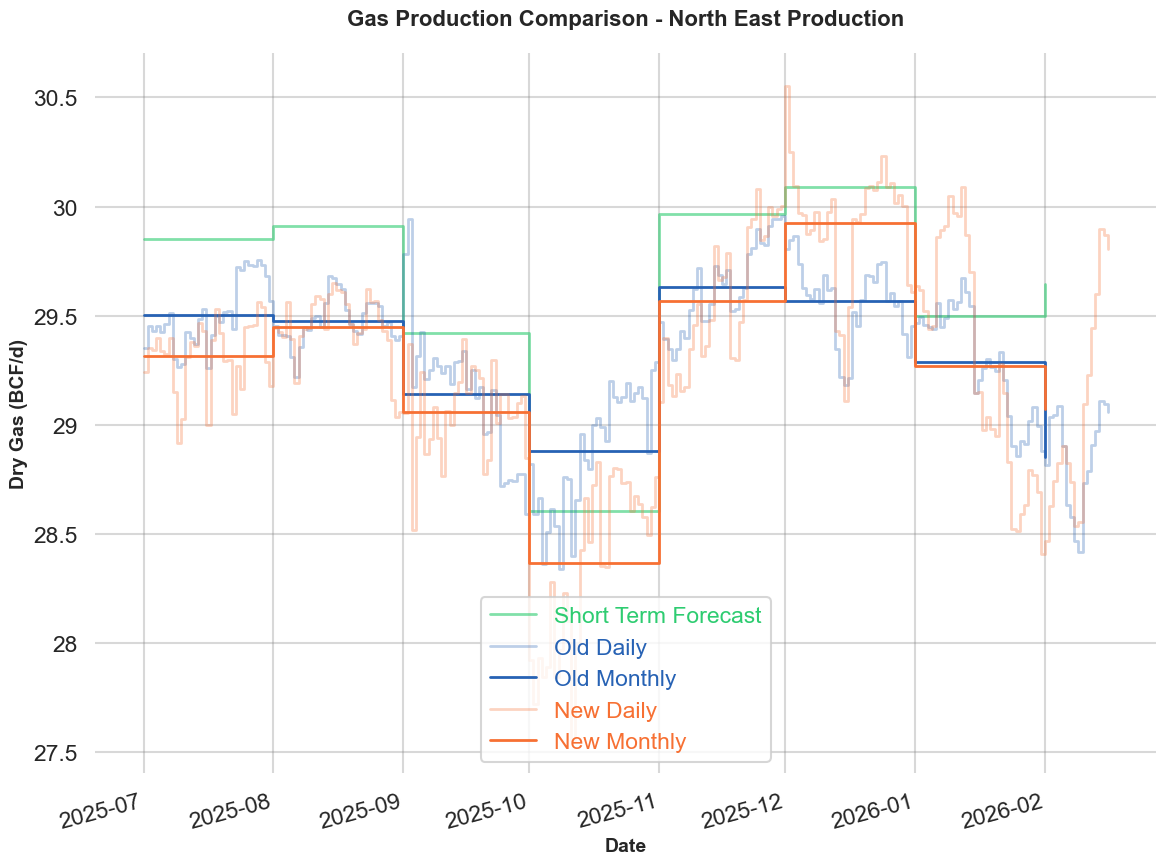
North East: +0.75 bcf/d currently:
Lower 48: +2.1 bcf/d currently: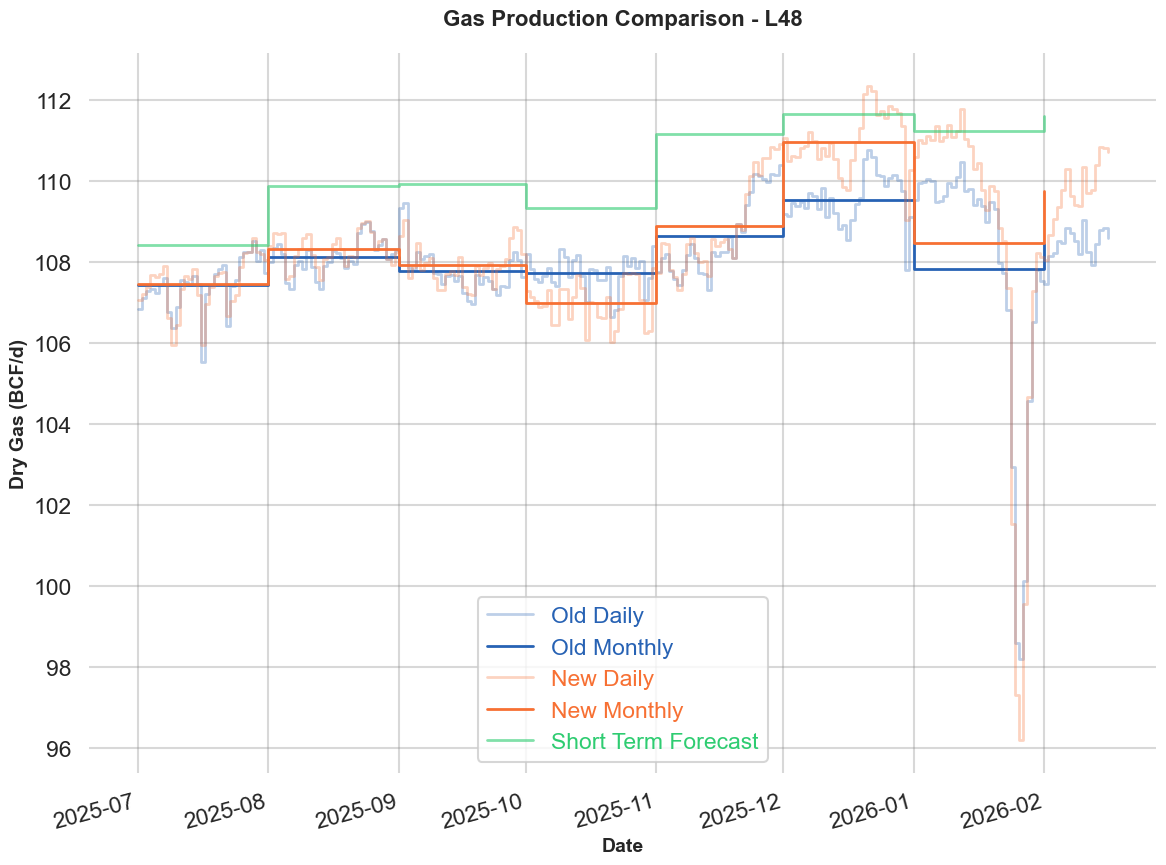
Note that this ALSO affects the Long Term Forecast. Since we have recalibrated what we think "today" is, and since the LTF is customarily based on growth, we have changed the LTF going forward (to change the past is "cheating"). As a result, it is revised from Mar-26 through Dec-28 for the following subregions: +0.98 Bcf/d for West TX, +0.13 Bcf/d for Permian NM, -0.02 Bcf/d for WV, +0.04 Bcf/d for SWPA, +0.20 Bcf/d for NEPA for a total of +1.33 Bcf/d for the Lower 48. This is purely a "shift" up, as we have not yet revised our thinking on trajectory- this is just a change in baseline.
What Does it Mean for You?
Whereas we used to only recalibrate every quarter, we believe that the changing conditions in much of the US pipeline infrastructure require us to examine these more frequently. Going forward, our intent is to examine, and possibly recalibrate our production model monthly, though for some less-dynamic regions, we will probably only recalibrate every quarter.
As usual, reach out to support@synmax.com with any questions.
-3.png?height=200&name=image%20(1)-3.png)
