
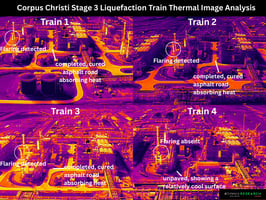
SynMax Research: This report was first delivered to SynMax Vulcan subscribers last week. Thermal...
New Dataset: TX Flaring
Texas Flaring, Now Queryable in Hyperion
See how much gas is being flared, where it is happening, which operators are involved, and what is driving it.
As one of the few states that still allows meaningful flaring, Texas remains an important blind spot in understanding Lower 48 production, especially in the Permian. Traders already know why flaring matters: it can point to constraints, disruption, operational stress, and gas that is being produced but not making it to market.
The problem has been access. Unlike North Dakota or New Mexico, Texas does not aggregate flaring data in a way that is easy to analyze. SynMax has now done that work, giving Hyperion users a clearer view of how much gas is being flared, where it is happening, which operators are involved, and what is driving it.
Instead of treating Texas flaring as a filing-by-filing research project, traders can now monitor it as part of their supply workflow: volume, location, operator, timing, and likely cause in one place.
What's New
Hyperion Production Datalink now includes three new Texas flaring tables built from Texas Railroad Commission filings. These tables provide daily, operator-level gas flaring data, including reported volumes, SynMax-estimated volumes where filings are incomplete, standardized reason categories, and optional geographic detail.
Use the data to answer questions such as:
- How much gas is being flared in Texas, and how is that changing over time?
- Which operators are flaring the most?
- Where is flaring concentrated by county or RRC district?
- Is flaring being driven by pipeline constraints, maintenance, system upsets, completions, or other causes?
- Which active exceptions are nearing expiration?
You can start with this sample dashboard to explore the data interactively, or query the tables directly through Hyperion Agents and Datalink. For more details, keep reading.
This document walks through common use cases with example agent prompts and the underlying SQL, followed by a full schema reference in the appendix.
Monthly Flaring Trend — Statewide
How much gas is Texas flaring each month, and is the trend improving?
Agent prompt (linked to dashboard with the data):
Show me total monthly gas flaring in Texas for the last 12 months, reported data only, in MCF/d.
Query (using hdl.flaring_records):
SELECT
    DATE_TRUNC('month', date) AS month,
    SUM(gas_flared_mcf) / COUNT(DISTINCT date) AS avg_mcf_per_day,
    COUNT(DISTINCT operator_name) AS operators_reporting
FROM hdl.flaring_records
WHERE date >= CURRENT_DATE - INTERVAL '12 months'
  AND source = 'reported'
GROUP BY 1
ORDER BY 1
API call (bash formatted):
curl -X POST "https://hyperion.api.synmax.com/v4/beta/query_datalinks" -H "Access-Key: $ACCESS_TOKEN" -H "Content-Type: application/json" -d '{"query": "SELECT DATE_TRUNC('\''month'\'', date) AS month, SUM(gas_flared_mcf) / COUNT(DISTINCT date) AS avg_mcf_per_day, COUNT(DISTINCT operator_name) AS operators_reporting FROM hdl.flaring_records WHERE date >= CURRENT_DATE - INTERVAL '\''12 months'\'' AND source = '\''reported'\'' GROUP BY 1 ORDER BY 1"}'
Example results:
|
month |
avg_mcf_per_day |
operators_reporting |
|---|---|---|
|
2025-06-01 |
482,310 |
287 |
|
2025-07-01 |
501,440 |
291 |
|
2025-08-01 |
478,900 |
284 |
|
... |
... |
... |
This view (hdl.flaring_records) is the default starting point. It has one row per operator-site-filing per day and includes the classified reason_label column for root-cause analysis.
Note that not all permits report their flaring volumes - we have source = 'estimated' rows that use SynMax's modeling to fill in gaps. To see only the reported values, filter to source = 'reported' only. For a more complete picture of current activity, include both but flag them. We estimate by looking each operator reporting ratio from the previous year, and applying that to the permitted volumes for the current year. So if an operator reported 80% of their permitted flaring volume last year, we assume they are also reporting 80% this year and scale up accordingly. This is not perfect but gives a more complete picture of current activity while we wait for filings to arrive.
Flaring by Subregion
Which RRC districts or counties are flaring the most?
Agent prompt:
Break down total gas flaring by RRC district and county for the last 6 months.
Query (using hdl.flaring_records_with_locations):
SELECT
    district,
    county,
    SUM(gas_flared_mcf * location_weight)
        / COUNT(DISTINCT date) AS weighted_avg_mcf_d
FROM hdl.flaring_records_with_locations
WHERE date >= CURRENT_DATE - INTERVAL '6 months'
  AND source = 'reported'
GROUP BY district, county
ORDER BY weighted_avg_mcf_d DESC
LIMIT 15
API call:
curl -X POST "https://hyperion.api.synmax.com/v4/beta/query_datalinks" -H "Access-Key: $ACCESS_TOKEN" -H "Content-Type: application/json" -d '{"query": "SELECT district, county, SUM(gas_flared_mcf * location_weight) / COUNT(DISTINCT date) AS weighted_avg_mcf_d FROM hdl.flaring_records_with_locations WHERE date >= CURRENT_DATE - INTERVAL '\''6 months'\'' AND source = '\''reported'\'' GROUP BY district, county ORDER BY weighted_avg_mcf_d DESC LIMIT 15"}'
Example results:
|
district |
county |
weighted_avg_mcf_d |
|---|---|---|
|
08 |
REEVES |
58,200 |
|
08 |
LOVING |
42,100 |
|
7C |
MIDLAND |
38,900 |
|
08 |
WARD |
31,600 |
|
... |
... |
... |
This view (hdl.flaring_records_with_locations) adds district, county, and lat/lon columns. Because a single lease can span multiple counties, each row carries a location_weight (0.0–1.0).
What is location_weight? When a lease straddles county or district boundaries, the view creates one row per county the lease touches. The location_weight column indicates what fraction of the lease's activity should be attributed to that county—for example, a lease split evenly across two counties would have 0.5 in each row. Always multiply volumes by location_weight before aggregating (e.g., SUM(gas_flared_mcf * location_weight)) to avoid double-counting the same flared gas across multiple rows.
Top Operators — Year to Date
Who are the largest flarers in 2026?
Agent prompt:
Rank the top 15 operators by average daily gas flared in 2026, reported data only.
Query (using hdl.flaring_records):
SELECT
    operator_name,
    SUM(gas_flared_mcf) / COUNT(DISTINCT date) AS avg_mcf_per_day,
    COUNT(DISTINCT site_name) AS sites
FROM hdl.flaring_records
WHERE date >= '2026-01-01'
  AND source = 'reported'
GROUP BY operator_name
ORDER BY avg_mcf_per_day DESC
LIMIT 15
API call:
curl -X POST "https://hyperion.api.synmax.com/v4/beta/query_datalinks" -H "Access-Key: $ACCESS_TOKEN" -H "Content-Type: application/json" -d '{"query": "SELECT operator_name, SUM(gas_flared_mcf) / COUNT(DISTINCT date) AS avg_mcf_per_day, COUNT(DISTINCT site_name) AS sites FROM hdl.flaring_records WHERE date >= '\''2026-01-01'\'' AND source = '\''reported'\'' GROUP BY operator_name ORDER BY avg_mcf_per_day DESC LIMIT 15"}'
Example results:
|
operator_name |
avg_mcf_per_day |
sites |
|---|---|---|
|
FLARE ENERGY LLC |
34,500 |
12 |
|
CONOCOPHILLIPS COMPANY |
28,200 |
45 |
|
DIAMONDBACK E&P LLC |
22,100 |
38 |
|
... |
... |
... |
Flaring by Reason Category
What is driving flaring — equipment failures, pipeline constraints, or something else?
Agent prompt:
Summarize daily average flaring by reason category for the last 6 months. Include the average reported volume of filings per reason.
Query (using hdl.flaring_records):
SELECT
    reason_label,
    SUM(gas_flared_mcf) / COUNT(DISTINCT date) AS avg_mcf_per_day,
    COUNT(*) AS filing_count
FROM hdl.flaring_records
WHERE date >= CURRENT_DATE - INTERVAL '6 months'
  AND reason_label IS NOT NULL
GROUP BY reason_label
ORDER BY avg_mcf_per_day DESC
API call:
curl -X POST "https://hyperion.api.synmax.com/v4/beta/query_datalinks" -H "Access-Key: $ACCESS_TOKEN" -H "Content-Type: application/json" -d '{"query": "SELECT reason_label, SUM(gas_flared_mcf) / COUNT(DISTINCT date) AS avg_mcf_per_day, COUNT(*) AS filing_count FROM hdl.flaring_records WHERE date >= CURRENT_DATE - INTERVAL '\''6 months'\'' AND reason_label IS NOT NULL GROUP BY reason_label ORDER BY avg_mcf_per_day DESC"}'
Example results:
|
reason_label |
avg_mcf_per_day |
filing_count |
|---|---|---|
|
Pipeline / Midstream Constraints |
142,300 |
48,200 |
|
Equipment Failure / Malfunction |
98,400 |
35,100 |
|
Well Completion / Flowback |
67,800 |
22,400 |
|
Regulatory / Safety |
41,200 |
15,600 |
|
... |
... |
... |
The reason_label column is populated by an classifier that reads the free-text reason field on each RRC filing. There are 14 standardized categories (See below for full explanation). Rows where the reason text was too ambiguous to classify will have a NULL reason_label.
Active Flaring Exceptions
Which operators currently hold RRC exceptions to flare, and when do they expire?
Agent prompt:
Show me all active flaring exceptions expiring in the next 90 days, sorted by days remaining.
Query (using hdl.active_exceptions):
SELECT
    operator_name,
    site_name,
    days_remaining,
    primary_county,
    primary_district,
    effective_date,
    expiration_date,
    reason_label
FROM 1007_hdl.active_exceptions
WHERE days_remaining <= 90
ORDER BY days_remaining ASC
LIMIT 15
API call:
curl -X POST "https://hyperion.api.synmax.com/v4/beta/query_datalinks" -H "Access-Key: $ACCESS_TOKEN" -H "Content-Type: application/json" -d '{"query": "SELECT operator_name, site_name, days_remaining, primary_county, primary_district, effective_date, expiration_date, reason_label FROM hdl.active_exceptions WHERE days_remaining <= 90 ORDER BY days_remaining ASC LIMIT 15"}'
Example results:
|
operator_name |
site_name |
days_remaining |
exception_type |
initial_date |
final_date |
|---|---|---|---|---|---|
|
XTO ENERGY INC |
MESA VERDE 4H |
8 |
RULE 32 |
2025-11-20 |
2026-05-20 |
|
DIAMONDBACK E&P LLC |
LIMELIGHT 1-2H |
14 |
RULE 32 |
2025-12-01 |
2026-06-01 |
|
... |
... |
... |
... |
... |
... |
This view (hdl.active_exceptions) is a metadata-only snapshot of currently authorized exceptions. It contains no volume data. To see how much gas an excepted operator is actually flaring, join to hdl.flaring_records on operator_name and site_name.
Important Business Rules
- Unit conversion: all volumes are stored as MCF (thousand cubic feet). To convert to BCF/d, divide by 1,000,000 and normalize by the number of days in your window.
- NULL does not mean zero: a NULL gas_flared_mcf means the filing exists but the volume was not reported or could not be parsed. Do not blindly substitute zero — filter these rows out or handle them explicitly.
- Reported vs. estimated: the source column distinguishes RRC-filed data (source = 'reported') from SynMax-modeled estimates (source = 'estimated'). For 'just the facts', filter to reported only. For a more complete picture of current activity, include both but flag them.
- Location weighting: hdl.flaring_records_with_locations can return multiple rows per filing (one per county). Always apply SUM(volume * location_weight) when aggregating, or you will overcount.
- Incomplete recent months: RRC filings arrive with a lag. The most recent 1–2 months of reported data will be incomplete. Use the estimated source to fill gaps when trend analysis requires a complete picture.
Questions? Contact support@synmax.com .
Appendix: Full Schema Reference
hdl.flaring_records
The default starting point — daily volumes by operator/site/filing with classified flaring reasons.
|
Column |
Type |
Description |
|---|---|---|
|
date |
date |
Filing date |
|
operator_name |
text |
Operator name as reported to the RRC |
|
operator_no |
text |
RRC operator number |
|
site_name |
text |
Lease or facility name |
|
filing_id |
text |
Unique RRC filing identifier |
|
gas_flared_mcf |
numeric |
Gas flared in MCF (nullable) |
|
casinghead_flared_mcf |
numeric |
Casinghead gas flared in MCF (nullable) |
|
gas_vented_mcf |
numeric |
Gas vented in MCF (nullable) |
|
source |
text |
'reported' (RRC filing) or 'estimated' (SynMax model) |
|
reason |
text |
Raw free-text reason from filing |
|
reason_label |
text |
classified category (14 values, nullable) |
The possible values of reason_label are:
System Upset (Third Party)
Insufficient Gas Gathering Capacity
System Upset (Operator)
Pipeline Unavailable
Avoiding Curtailment
Unscheduled Maintenance
Scheduled Maintenance
Unknown
Economic Impracticability
Well Completion / Extended Clean-Up
Off-Spec Gas Quality
Authorized Volume Exceedance
Operator Transfer Continuation
Other
hdl.flaring_records_with_locations
Same as flaring_records plus geographic detail. Use when mapping or aggregating by county/district.
|
Column |
Type |
Description |
|---|---|---|
|
(all columns from flaring_records) |
||
|
district |
text |
RRC district code |
|
county |
text |
Texas county name |
|
latitude |
numeric |
Lease centroid latitude |
|
longitude |
numeric |
Lease centroid longitude |
|
location_weight |
numeric |
0.0–1.0 weight for multi-county leases |
hdl.active_exceptions
Metadata-only snapshot of currently authorized RRC flaring exceptions. No volume data.
|
Column |
Type |
Description |
|---|---|---|
|
operator_name |
text |
Operator name |
|
operator_no |
text |
RRC operator number |
|
site_name |
text |
Lease or facility name |
|
exception_type |
text |
RRC rule type (e.g., RULE 32) |
|
initial_date |
date |
Exception start date |
|
final_date |
date |
Exception end date |
|
days_remaining |
integer |
Days until expiration from today |
|
status |
text |
Current status |

